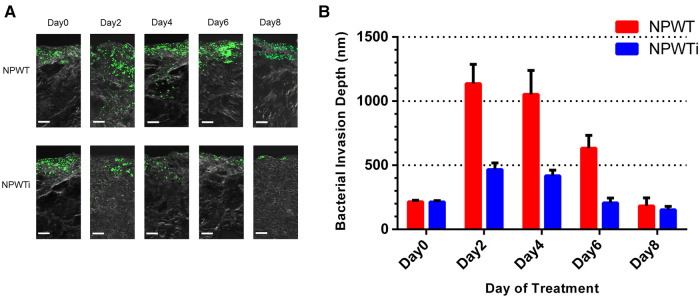
Figure 5.
Bacterial invasion depth observed by laser scanning confocal microscopy. (A) This figure shows the depth of infection in NPWT and NPWTi on days 0, 2, 4, 6, and 8. (B) Bacterial invasion depth significantly descended in the NPWTi group compared with the NPWT group at day 2, 4, 6, and day 8 (*P < 0.001). Scale bar was 100 um.

