Figure 2.
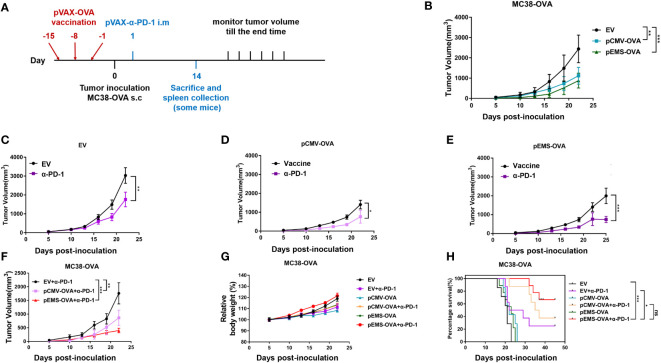
Anti-tumor activity of DNA vaccination and intramuscular gene transfer of PD-1 antibody combination in MC38-OVA model. (A) Schematic protocol of the tumor inoculation, DNA vaccination and pVAX-α-PD-1-Fc injection, and tumor measurement in MC38-OVA model. The DNA vaccines (pCMV-OVA or pEMS-OVA) were pre-intramuscularly electroporated 15 days, 8 days, and 1 day before 2 × 10⁵ MC38-OVA tumor cells were subcutaneously injected into the right flanks of C57BL/6 mice. pVAX-α-PD-1-Fc were intramuscularly electroporated on day 1. Thereafter, the tumor volume was monitored every 3 days until mice were sacrificed. (B) Tumor growth curves of three different vaccine groups. The tumor growth curves of the empty vector (C), pCMV-OVA (D), and pEMS-OVA (E) DNA vaccination combined with pVAX-α-PD-1-Fc groups. (F) Tumor growth curves of three kinds in the pVAX-α-PD-1-Fc group. Relative body weight change (G) and percentage of survival curve (H) of mice receiving six different treatments. The error bars represent the mean ± SEM; n = 6 per group. Statistical analysis was carried out using one-way ANOVA with Dunnett’s multiple comparisons test or a Student’s t-test. The log-rank (Mantel-Cox) test was used to calculate the significance of survival (*p < 0.05, **p < 0.01, and ***p < 0.001). ANOVA, analysis of variance.

