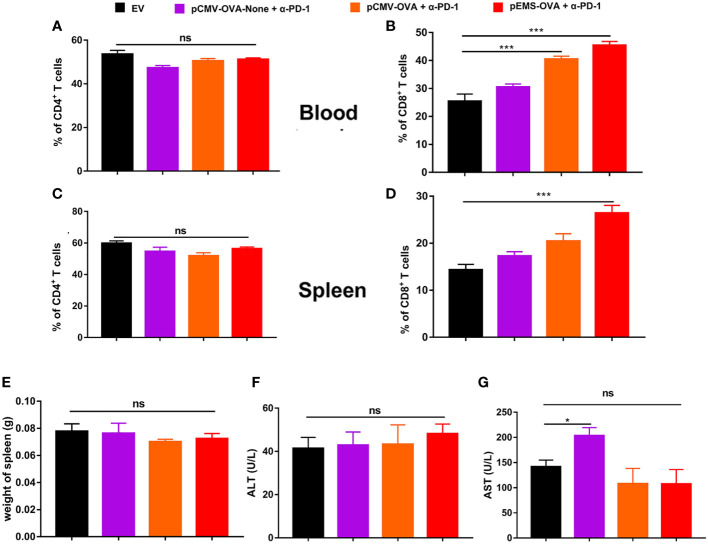
Figure 6.
Immune cell populations and biochemical analysis of combination DNA vaccination and intramuscular gene transfer of PD-1 antibody in B16F10-OVA model. All mice were sacrificed at day 29. Immune cell populations analysis of spleen and blood from mice receiving four different treatments. (A) Percentage of CD4+ T cells in the blood. (B) Percentage of CD8+ T cells in the blood. (C) Percentage of CD4+ T cells in the spleen. (D) Percentage of CD8+ T cells in the spleen. (E) Spleen weight. (F) ALT level in the serum of mice. (G) AST level. Data are shown as means ± SDs. Statistical analyses were performed using one-way ANOVA with Dunnett’s multiple comparison test. *p < 0.05; **p < 0.01; ***p < 0.001. ANOVA, analysis of variance; AST, aminotransferase; ALT, alanine aminotransferase. .

