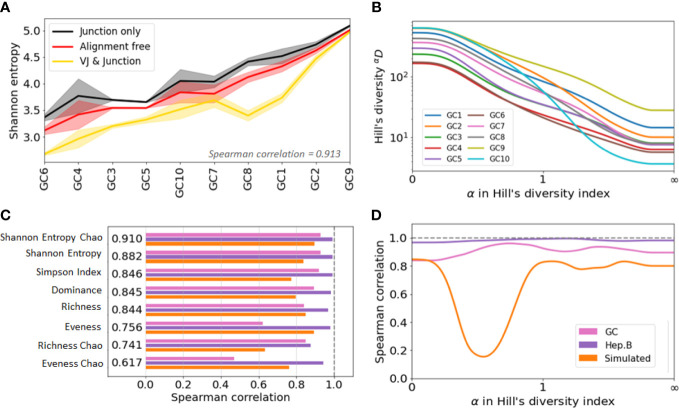
Figure 4.
Agreement analysis of diversity indices across different clone identification methods. (A) Shannon entropy diversity index for each GC, listed from least to most diverse. As there are two replicates for each GC, the solid line represent the mean value between the two replicates, and the shaded area highlights the min and max values. (B) Spearman correlation between the diversity indices obtained with the three clonal identification methods. The computed correlation is shown for the three datasets analyzed in our study. The figure shows the average correlation across the three datasets. (C) Hill’s Diversity profiles of each GC (averaged over the two replicated) with clones obtained from the alignment free method (the x-axis has been transformed with an exponential tangent function for visual clarity). (D) Mean Spearman correlation between the diversity indices obtained with the three clonal identification methods.

