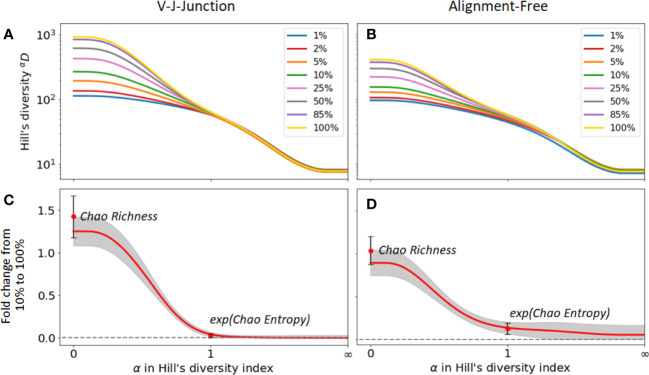
Figure 5.
Sensitivity of diversity metrics to sequencing depth for the GC dataset. (A, B) Hill’s diversity profile calculated at different sub-sampling ratios varying from 1% to 100%. (C, D) Fold changes between Hill’s diversity index computed respectively at 10% sub-sampling and 100% sampling. The mean (read line) and one standard deviation (grey shaded area) across the 100 sub-sampling repetitions are shown in both figures. Similarly, the mean and standard deviation of the Chao estimator for richness and entropy are shown.

