
FIGURE 6.
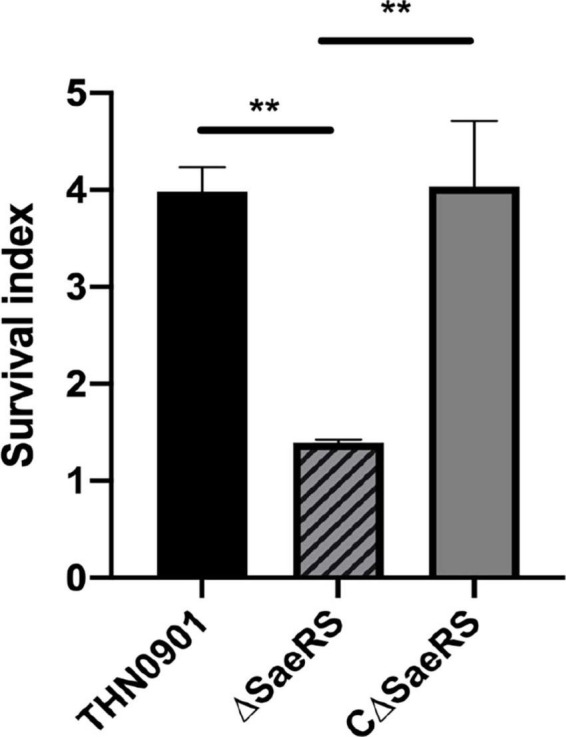
Whole blood-killing assay. The survival index was calculated. Each experiment was performed in triplicate, and data were presented as mean ± standard deviation (SD), *: 0.01 < P < 0.05, **: P < 0.01.
Official websites use .gov
A
.gov website belongs to an official
government organization in the United States.
Secure .gov websites use HTTPS
A lock (
) or https:// means you've safely
connected to the .gov website. Share sensitive
information only on official, secure websites.
Whole blood-killing assay. The survival index was calculated. Each experiment was performed in triplicate, and data were presented as mean ± standard deviation (SD), *: 0.01 < P < 0.05, **: P < 0.01.