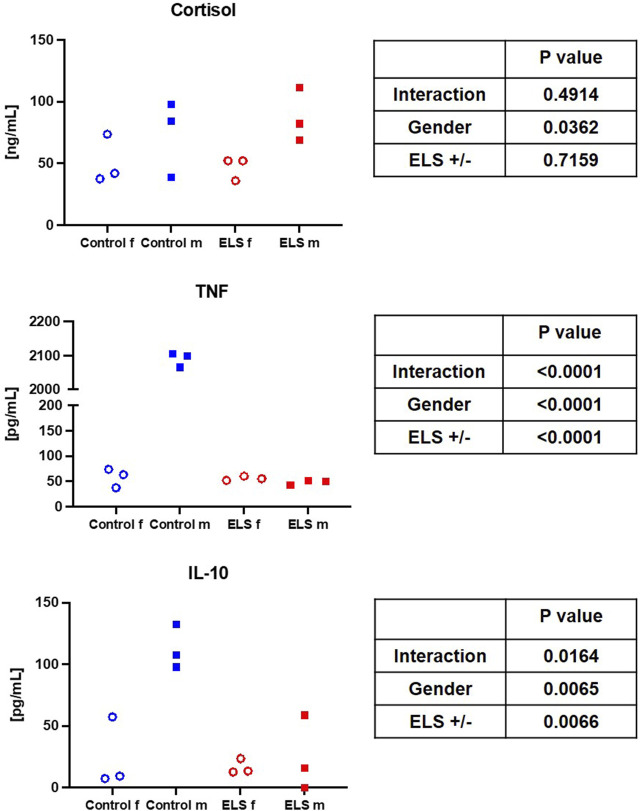
FIGURE 1.
Serum cortisol, tumor necrosis factor (TNF, left panel) and interleukin-10 (IL-10, right panel) levels in the in the control (blue symbols) and Early Life Stress (ELS; red symbols) groups separated for male (“m”, solid squares) and female (“f”, open circles) swine. Note that male control animals showed markedly higher cytokine concentrations than females, while there was no sex-related difference in the ELS swine.

