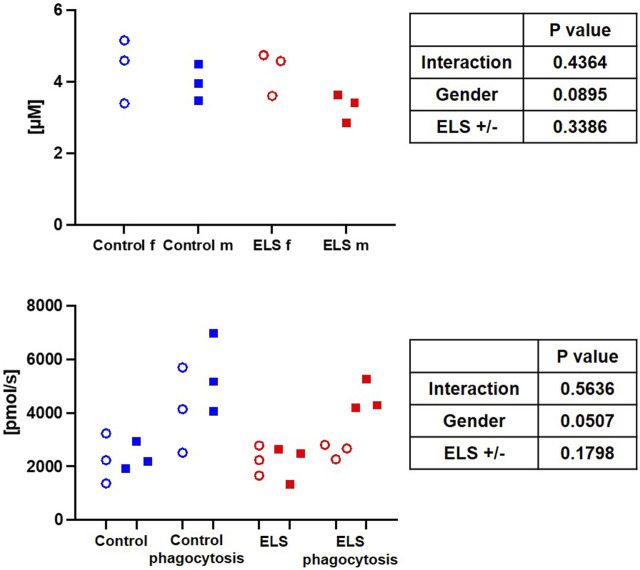
FIGURE 4.
Whole blood superoxide anion (O2 •¯) concentration in the control (blue symbols) and Early Life Stress (ELS; red symbols) groups separated for male (“m”, solid squares) and female (“f”, open circles) swine (upper panel). Granulocyte superoxide anion (O2 •¯) production at baseline and after stimulation of phagocytosis with E. coli in control (blue symbols) and Early Life Stress (ELS; red symbols) animals separated for male (solid symboles) and female (open symboles) swine (lower panel). Each symbol refers to samples from an individual animal. Note that O2 •¯ release increased upon stimulation in all samples from male swine irrespective of the presence/absence of ELS, while this response was abolished in female animals with ELS.

