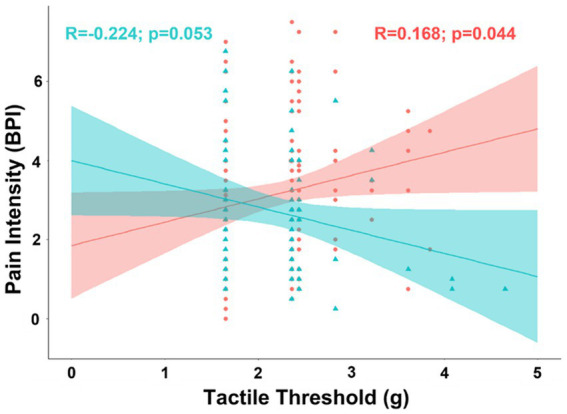
Figure 2.

Scatterplot displaying the correlation between intensity of chronic pain and tactile sensitivity separated into female (coral/red) and male groups (arctic green/cyan). Coral and arctic green shaded areas correspond to 95% confidence curves.
