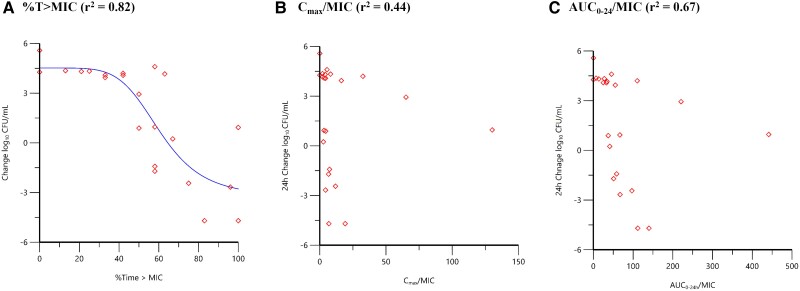
Figure 1.
The 24-hour change in Acinetobacter baumannii Astra research collection (ARC)2058 (ADC-99 [N379S]; oxacillinase [OXA]-259) CFU/mL relative to sulbactam time (T) > MIC (A), Cmax/MIC (B), and AUC0–24/MIC (C) based on data from a hollow-fiber in vitro infection model (O'Donnell et al., Unpublished data): (A) %T > MIC (r2 = 0.82); (B) Cmax/MIC (r2 = 0.44); (C) AUC0–24/MIC (r2 = 0.67). Red diamond symbols represent PK parameter estimates derived from each dose fractionated regimen vs. the change in bacterial burden over 24 hours. The line represents the non-linear regression analysis of the data using the Hill equation. Abbreviations: AUC0–24, area under the concentration-time curve over 0 to 24 hours; CFU, colony-forming units; Cmax, maximum concentration; MIC, minimum inhibitory concentration.

