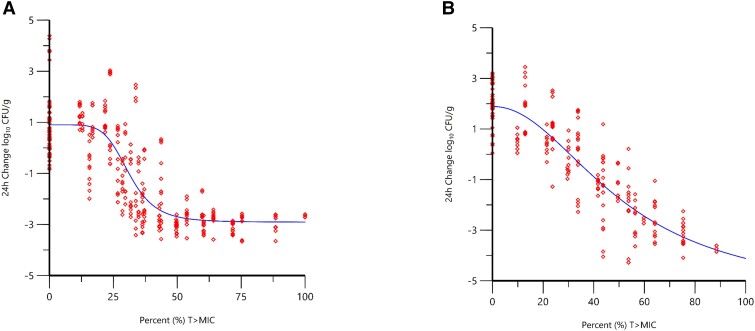
Figure 2.
Change in bacterial burden (log10 CFU/g) over 24 hours vs %fT > MIC of sulbactam when administered alone and combined with durlobactam based on data from neutropenic murine thigh (r2 = 0.83, n = 6 isolates) (A) and lung (r2 = 0.89, n = 5 isolates) (B) infection models (O'Donnell et al., Unpublished data). Red diamond symbols represent PK parameter estimates derived from each dose fractionated regimen vs. the change inbacterial burden over 24 hours. The line represents the non-linear regression analysis of the data using the Hill equation. Abbreviations: CFU, colony-forming units; fT > MIC, time that unbound drug concentration remains above the minimum inhibitory concentration; MIC, minimum inhibitory concentration.

