. 2023 Jan 31;4(3):208–227. doi: 10.1158/2643-3230.BCD-22-0128

Figure 2.

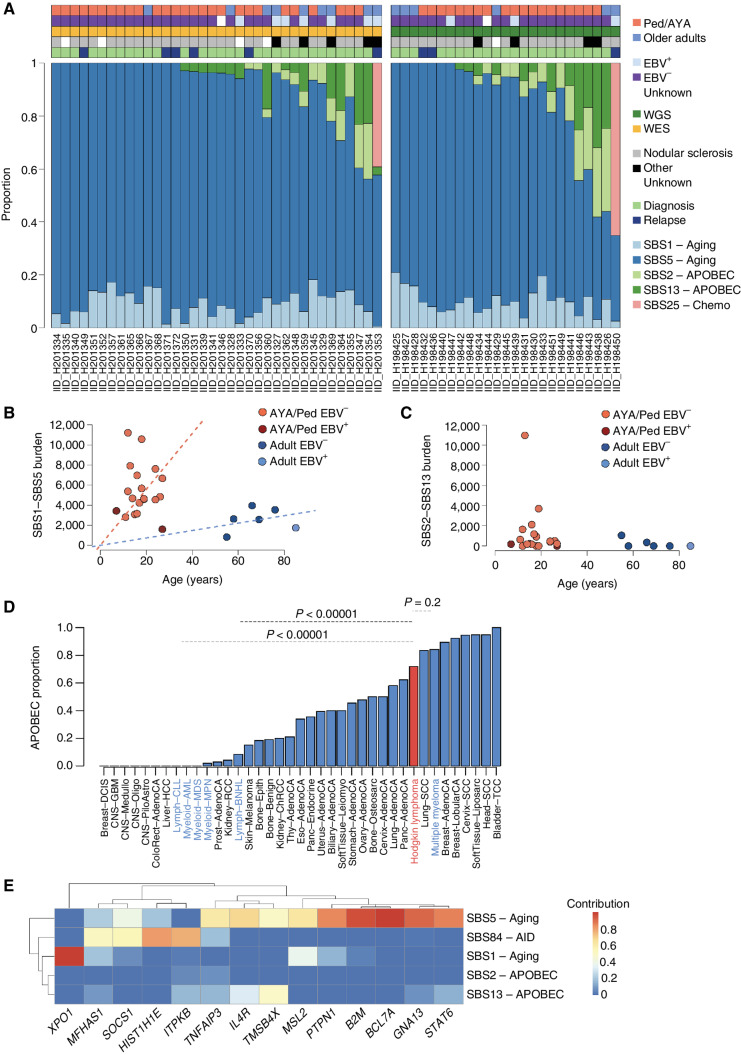
Figure 2. Mutational signatures in cHL. A, Contribution of mutational signatures across 25 and 36 cHL cases with available WGS and WES data, respectively. B and C, Linear regression showing the association between age and SBS1/SBS5 mutational burden (top) and SBS2/SBS13 (bottom) among the 25 cases evaluated by WGS. D, Proportion of patients with any APOBEC activity across cHL and other cancers included in the PCAWG and MM WGS studies. cHL is highlighted in red, and other hematologic cancers in blue. E, Mutational signatures contribution among all coding mutations occurring within recurrently mutated driver genes with at least 10 SBS (n = 61 cases evaluated by either WGS or WES).

Mutational signatures in cHL. A, Contribution of mutational signatures across 25 and 36 cHL cases with available WGS and WES data, respectively. B and C, Linear regression showing the association between age and SBS1/SBS5 mutational burden (top) and SBS2/SBS13 (bottom) among the 25 cases evaluated by WGS. D, Proportion of patients with any APOBEC activity across cHL and other cancers included in the PCAWG and MM WGS studies. cHL is highlighted in red, and other hematologic cancers in blue. E, Mutational signatures contribution among all coding mutations occurring within recurrently mutated driver genes with at least 10 SBS (n = 61 cases evaluated by either WGS or WES).