. 2023 Feb 9;4(3):180–207. doi: 10.1158/2643-3230.BCD-22-0086

Figure 2.

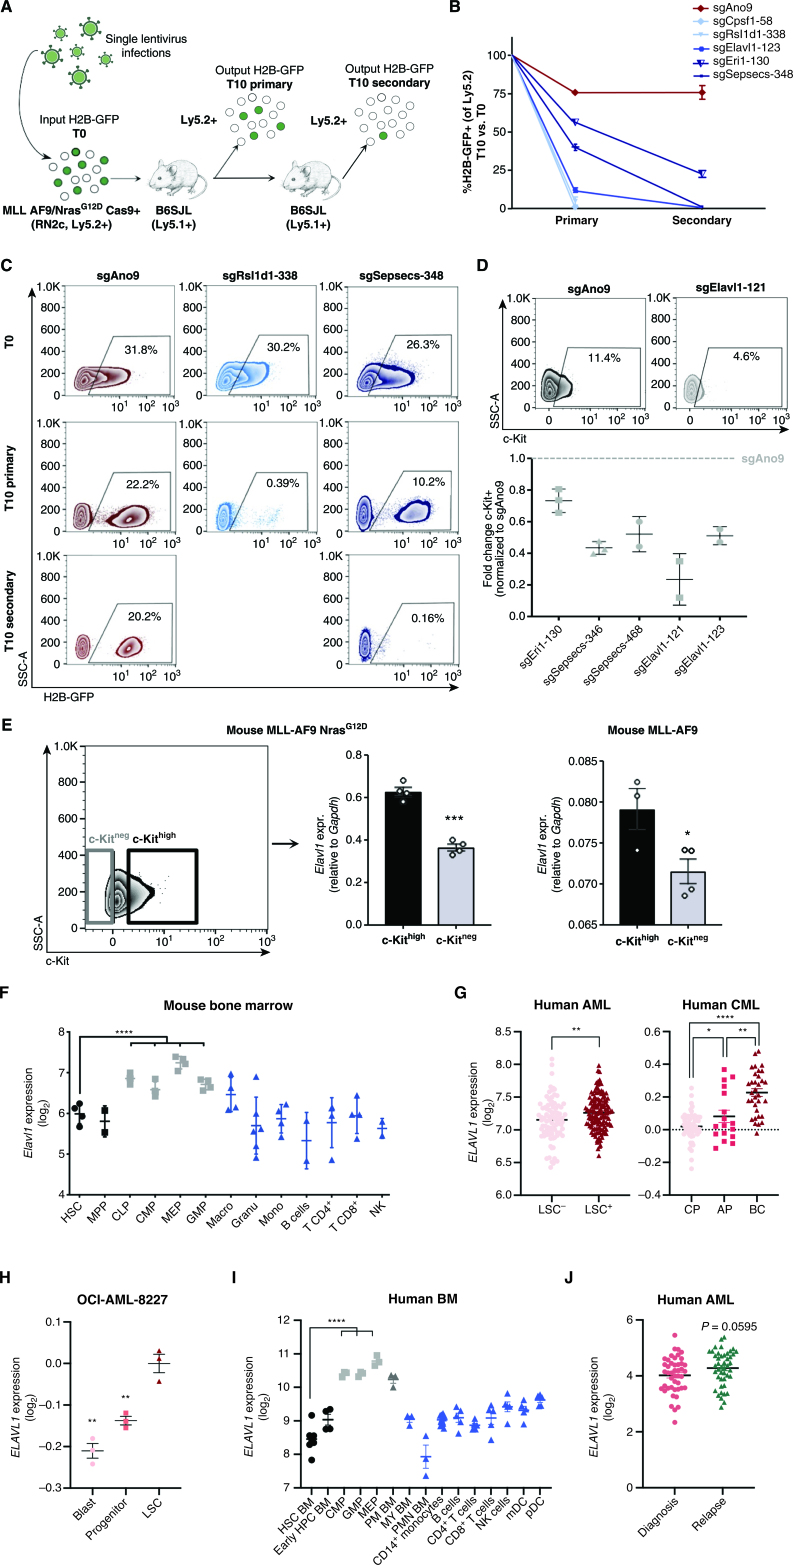
Figure 2. Independent hit knockout validation replicates pooled CRISPR-Cas9 screen dropout dynamics and identifies ELAVL1 as a top LSC dependency. A, Schematic illustrating the in vivo screen validation strategy. B, Percentage of H2B-GFP+ cells in the output graft as compared with the T0 input. sgAno9 is the negative control and darkening shades of blue correlate with increasing time in vivo before sgRNA dropout. C, Representative flow plots of RN2c cells sampled at each time point (T0, T10 primary, T10 secondary) are shown. D, Fold change (FC) of cKit+ fractions within H2B-GFP+ populations of BM samples with >5% H2B-GFP+ of Ly5.2+. E, Transcript expression of Elavl1 in LSC+ (cKithigh, top 25%) and LSC− (cKitneg) MLL-AF9 NrasG12D (RN2c) cells (left; flow sorting gates are shown) and MLL-AF9 cells (right). F, Levels of Elavl1 mRNA across various subpopulations of the mouse hematopoietic hierarchy, adapted from BloodSpot. Mature hematopoietic lineages, progenitor populations, and primitive populations are shown in blue, gray, and black, respectively. G, Human ELAVL1 expression in LSC+ and LSC− AML subfractions (27) and throughout CML disease stages (adapted from ref. 46 and www.oncomine.org) are shown in left and right, respectively. H, Expression of ELAVL1 in subpopulations of OCI-AML-8227 cell line. I, Transcript levels of ELAVL1 across sorted subfractions of the human BM hematopoietic hierarchy, adapted from BloodSpot (43). Mature hematopoietic lineages, progenitor populations, and primitive populations are shown in blue, gray, and black, respectively. J, ELAVL1 expression levels across paired diagnosis-relapse primary human AML samples. *, P< 0.05; **, P < 0.01; ***, P < 0.001; ****, P < 0.0001, as determined by a two-sided Student t test. Error bars, SEM.

Independent hit knockout validation replicates pooled CRISPR-Cas9 screen dropout dynamics and identifies ELAVL1 as a top LSC dependency. A, Schematic illustrating the in vivo screen validation strategy. B, Percentage of H2B-GFP+ cells in the output graft as compared with the T0 input. sgAno9 is the negative control and darkening shades of blue correlate with increasing time in vivo before sgRNA dropout. C, Representative flow plots of RN2c cells sampled at each time point (T0, T10 primary, T10 secondary) are shown. D, Fold change (FC) of cKit+ fractions within H2B-GFP+ populations of BM samples with >5% H2B-GFP+ of Ly5.2+. E, Transcript expression of Elavl1 in LSC+ (cKithigh, top 25%) and LSC (cKitneg) MLL-AF9 NrasG12D (RN2c) cells (left; flow sorting gates are shown) and MLL-AF9 cells (right). F, Levels of Elavl1 mRNA across various subpopulations of the mouse hematopoietic hierarchy, adapted from BloodSpot. Mature hematopoietic lineages, progenitor populations, and primitive populations are shown in blue, gray, and black, respectively. G, Human ELAVL1 expression in LSC+ and LSC AML subfractions (27) and throughout CML disease stages (adapted from ref. 46 and www.oncomine.org) are shown in left and right, respectively. H, Expression of ELAVL1 in subpopulations of OCI-AML-8227 cell line. I, Transcript levels of ELAVL1 across sorted subfractions of the human BM hematopoietic hierarchy, adapted from BloodSpot (43). Mature hematopoietic lineages, progenitor populations, and primitive populations are shown in blue, gray, and black, respectively. J,ELAVL1 expression levels across paired diagnosis-relapse primary human AML samples. *, P < 0.05; **, P < 0.01; ***, P < 0.001; ****, P < 0.0001, as determined by a two-sided Student t test. Error bars, SEM. AP, accelerated phase; CP, chronic phase.