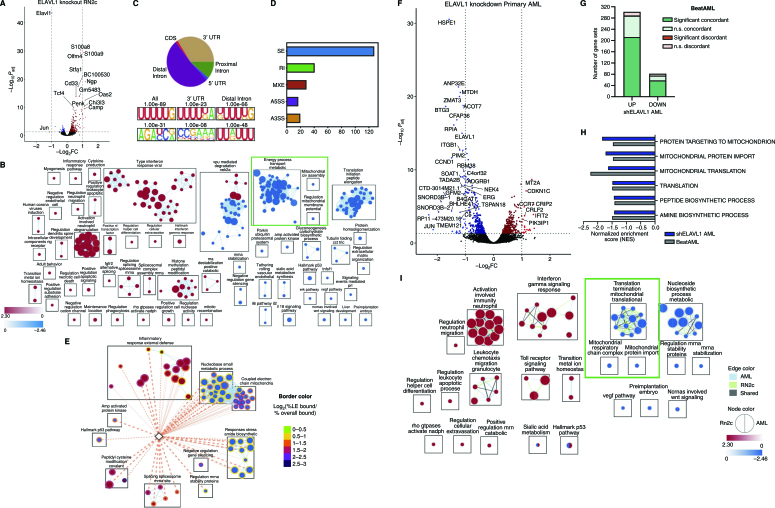
Figure 6.
Characterization of the ELAVL1-dependent circuitry in primitive leukemic cells. A, Volcano plot of differential gene expression in ELAVL1-knockout RN2c RNA sequencing (RNA-seq) Genes with significant differences in expression are highlighted. Blue and red dots represent genes significantly downregulated or upregulated, respectively, using a Padj < 0.05 (RNA-seq) cutoff. B, Enrichment map of gene sets significantly enriched (FDR < 0.1) in the transcriptome of ELAVL1-knockout RN2c cells. C, Distribution of ELAVL1 eCLIP peaks in different genic regions (top) and most common ELAVL1-binding motif sequences (bottom) in mouse bcCML cells. D, Distribution of splicing events in ELAVL1-knockout RN2c cells. E, Enrichment map of pathways enriched (FDR < 0.1) in the ELAVL1-knockout RN2c transcriptome and containing >5% of leading-edge transcripts bound by ELAVL1. Color of borders is based on the enrichment of transcript binding to leading edge relative to gene set background. F, Volcano plot of differential gene expression in ELAVL1-KD human primary AML. Blue and red dots represent genes significantly downregulated or upregulated, respectively, using a Padj < 0.05 cutoff. G, Number of pathways in the human ELAVL1-knockdown AML transcriptome that are significantly or nonsignificantly concordant and discordant in the BeatAML RNA-seq data set. H, Normalized enrichment scores (NES) of downregulated mitochondrial gene sets in the human ELAVL1-knockdown RNA-seq data set (highlighted by the green box in Supplementary Fig. S6I). I, Enrichment map of gene sets significantly (FDR < 0.25) altered in both ELAVL1-knockdown human AML and ELAVL1-knockout RN2c transcriptomes.

