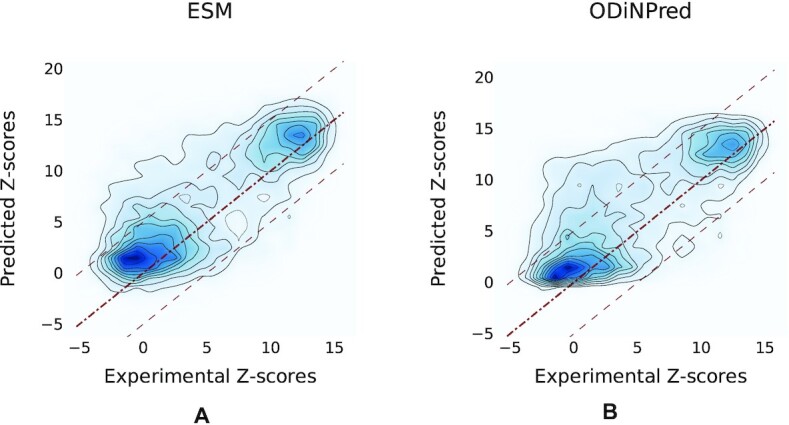
Figure 3.

Contour plots showing the density levels of experimental versus predicted Z-scores for the validation set containing 117 sequences: panel (A) shows results obtained with ESM transformer-based predictor (here ESM-1b was used) and panel (B) shows the results obtained with ODiNPred. Diagonal reference lines indicate the idealized ‘perfect’ prediction; i.e. predicted values are equal to the experimental values. As the probability mass around the reference line is tighter for the ESM-based predictor on the left, its accuracy is better than that of ODiNPred. This is further supported by the average prediction error and MAE for the two predictors (see Table 2). Z-scores predicted by ODiNPred were retrieved via the publicly available web service referenced in (39). Note that using these predicted Z-scores a slightly higher Spearman correlation of 0.671 was found, rather than 0.649 as reported in (39). Recall that the Spearman correlation for ESM-1b was 0.686. Note that the difference between correlation coefficients 0.671 and 0.686 was found to be significant (one-sided P-value = 0.0122) based on the Fisher r-to-Z transformation.
