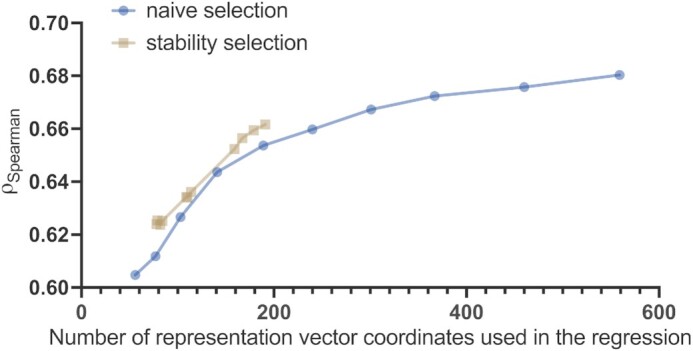
Figure 5.

Predictive power of the residue-level representation vectors as a function of the number of their coordinates used in the regression. Here, the transformer ESM-1b was used, and the predictive power was quantified in terms of  between actual and predicted Z-scores on the validation set containing 117 sequences. Naive selection (blue line) is based on the magnitude of the regression coefficients and stability selection (red line) is a more robust technique based on resampling; more details are provided in the ‘Discussion’ section.
