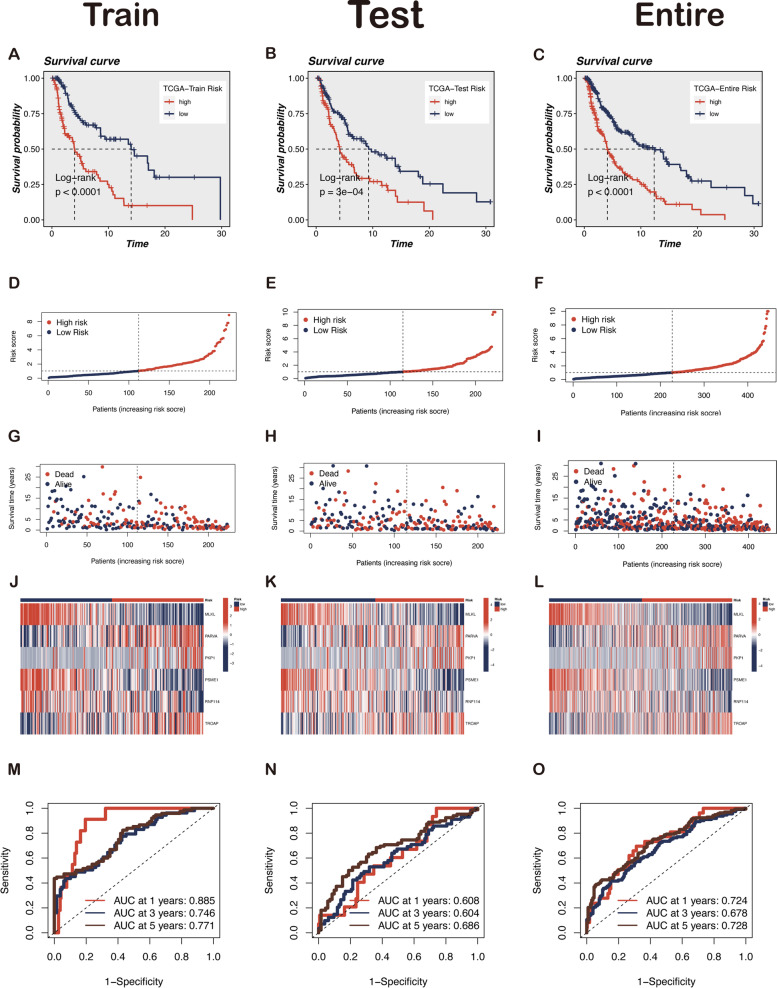
Fig. 3.
Comparison in stratified with risk signature of the six LLPS-associated genes in the TCGA cohort. A-C Overall survival was significantly different between patients with high and low risk scores. The distribution of the risk scores D-F, overall survival status G-I, and the expression of LLPS-related genes J-L among melanoma patients was shown (low-risk population: on the left side of the dotted line; high-risk population: on the right side of the dotted line; blue-black represents the number of survivors, and red represents the number of deaths. The risk from low to high reveals a rising tendency in deaths). M–O The ROC curves of the prognostic signature reflect the accuracy of the model in predicting patient survival at 1-, 3-, and 5 years

