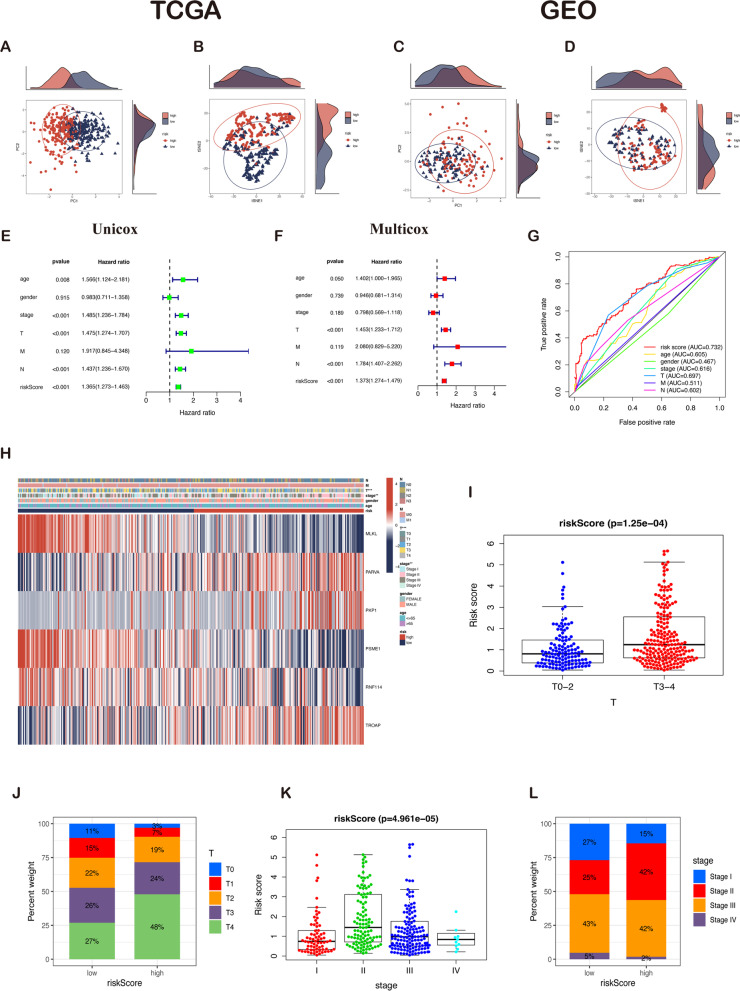
Fig. 5.
Prognostic value of clinicopathological factors and risk scores in the TCGA cohort. A The PCA plot in the TCGA cohort. B The t-SNE plot in the TCGA cohort. C The PCA plot in the GEO cohort. D The t-SNE plot in the GEO cohort. E Univariate Cox analysis showed that risk score (p < 0.001, HR = 1.365, 95% CI: 1.273–1.463) was associated with OS. F Multivariate Cox analysis demonstrated risk score (p < 0.001, HR = 1.373, 95% CI: 1.274–1.479) was independently correlated with OS. G The ROC curve of the risk score had the largest AUC of 0.732 compared with the other clinical variables. H Heatmap (blue: low expression; red: high expression) for the relationship between clinicopathologic features and the risk groups, indicating that T and stage were significantly different between the two groups. I Patients with melanoma of T3-4 had significantly higher risk scores than those with T1-2. J Patients with T3 and T4 stage accounted for the largest proportion in the high-risk group. K Risk scores of patients with different stages had significant differences. L Stage III melanoma patients accounted for the largest proportion in the low-risk group, and patients with stage II melanoma in the high-risk group increased significantly compared to the low-risk group. Note: *** P ≤ 0.001. ** P ≤ 0.01. * P ≤ 0.05

