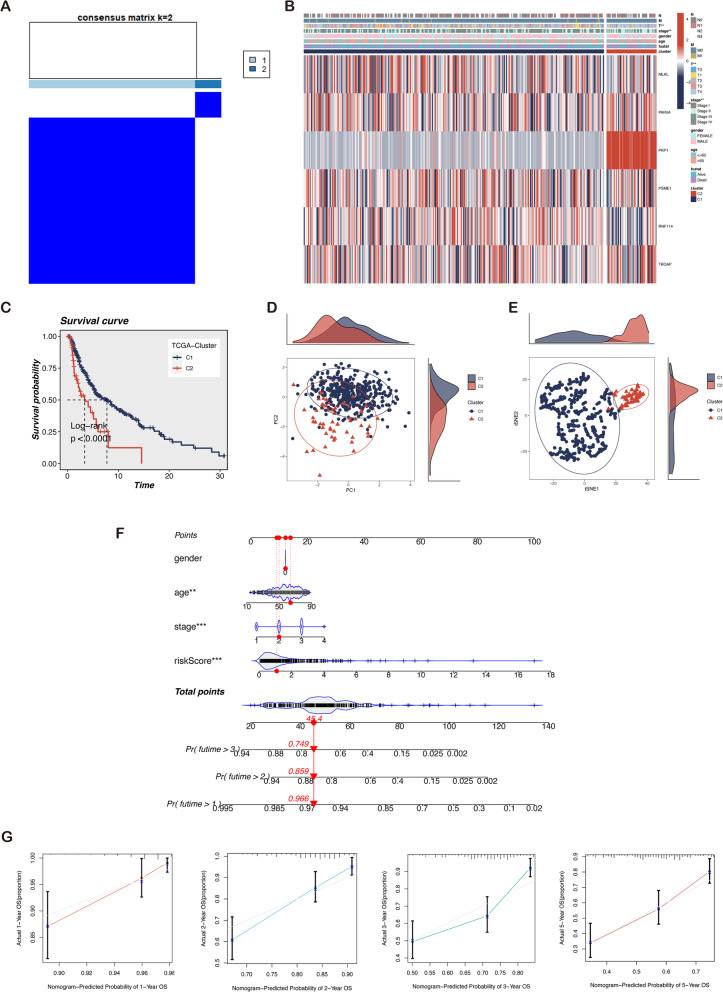
Fig. 6.
Tumor classification based on the identified prognostic LLPS-associated genes. A Stratification of 447 melanoma patients into two clusters according to the consensus clustering matrix (k = 2). B Heatmap and the clinicopathologic characteristics of the two clusters. C Kaplan–Meier curves showed the OS of cluster 1(blue) and cluster 2 (yellow) for melanoma patients. Cluster 2 had a worse prognosis than cluster 1 (P < 0.001). D The PCA plot between two clusters. E The t-SNE plot between two clusters. F Nomogram for the prediction of 1-, 3-, and 5-year survival probability in patients with melanoma. G The calibration plots test consistency between the actual OS rates and the predicted survival rates, with the 45°line representing the best prediction. Note: *** P ≤ 0.001. ** P ≤ 0.01. * P ≤ 0.05

