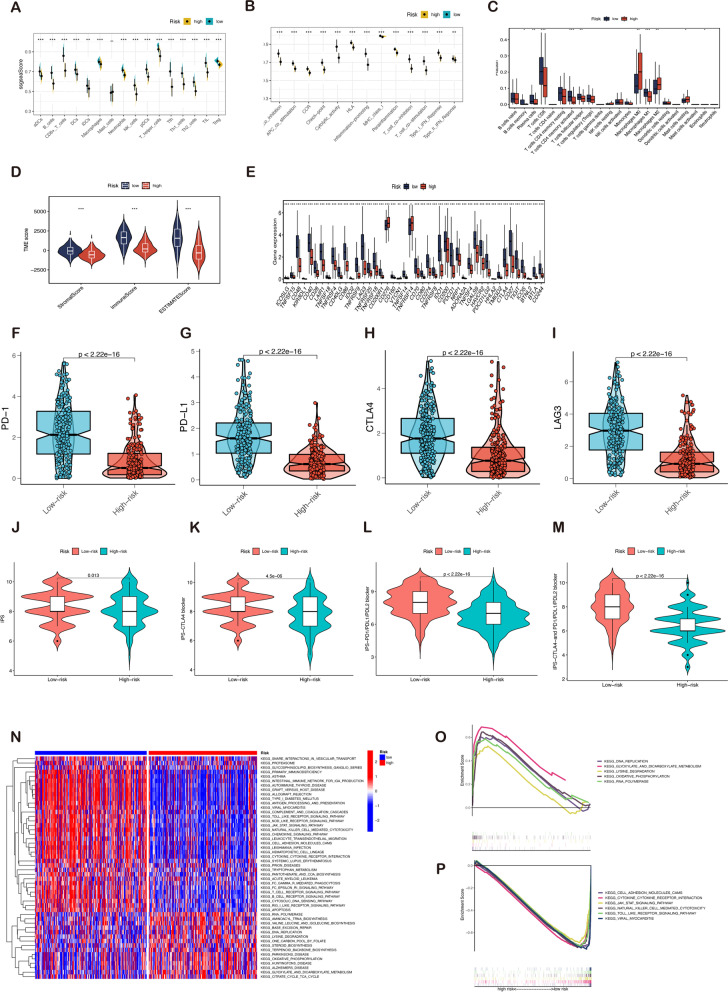
Fig. 8.
Analysis of immune infiltration, tumor microenvironment, and immunotherapy evaluation. The association between risk score and 16 types of immune cells A and 13 immune-related functions B in the low (blue box) and high-risk (red box) groups. C The proportional differences of specific 22 immune fractions were calculated by the CIBERSORT method in two groups. D The violin plot demonstrated the difference in ESTIMATE Score, Immune Score, and Stromal Score calculated using the ESTIMATE algorithm between the two groups. Scores of components in the tumor microenvironment in the low-risk group were significantly higher than those in the high-risk group. E Association of 47 immune checkpoint gene expression with risk score levels in melanoma. The mRNA expression of F PD-1, G PD-L1, H CTLA4, and I LAG3 in the low-risk group were significantly higher than that in the high-risk group. The low-risk subtype has significantly greater IPS J, IPS-CTLA4 blocker K, IPS-PD1/PDL1/PDL2 blocker L, and IPS-CTLA and PD1/PDL1/PDL2 blocker M compared to the high-risk subtype. N The overview of gene set enrichment analysis between risk groups. O Metabolism-related pathways were concentrated in the high-risk group. P Immune regulation and tumor-associated signaling pathways were enriched in the low-risk group. Note: *** P ≤ 0.001. ** P ≤ 0.01. * P ≤ 0.05

