Fig. 9.
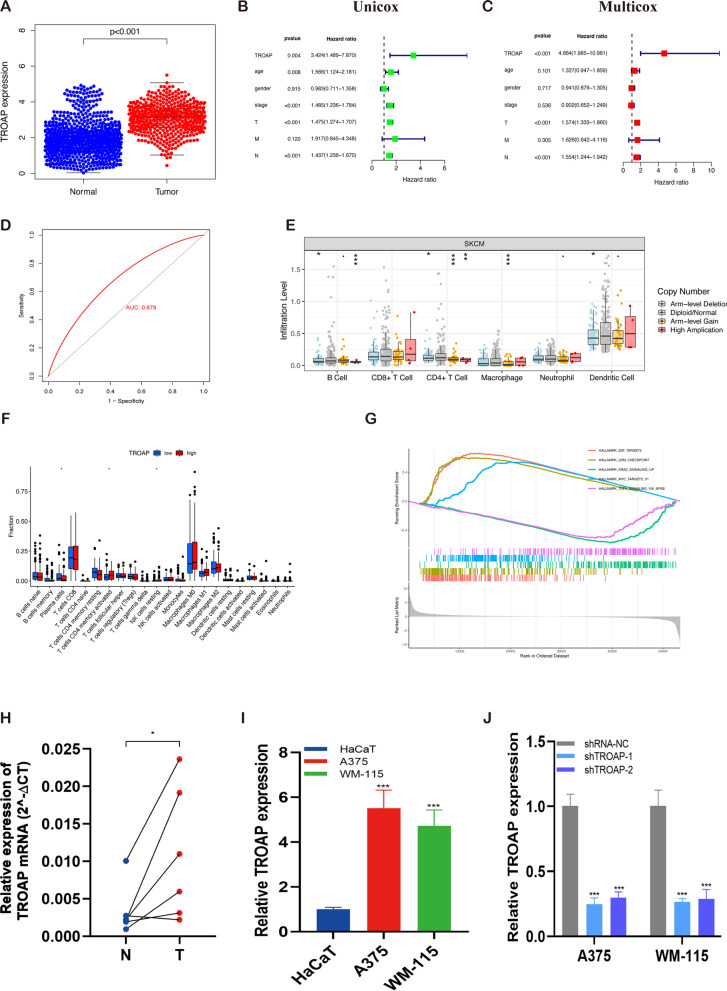
TROAP expression and prognostic value in melanoma. A TROAP was highly expressed in melanoma samples compared to the corresponding normal tissues of the GTEx-skin dataset as a control. The univariate B and multivariate C Cox regression analysis revealed the role of TROAP in predicting melanoma survival. D TROAP has a robust diagnostic accuracy for melanoma with an AUC value of 0.679 for the ROC curve. E TROAP copy number variation (CNV) correlates with immune cell infiltration levels in the TIMER database. F The violin represented immune cell infiltration in the low TROAP expression (blue) and the high TROAP expression (red) groups. G GSEA enrichment plots represented enriched biological pathways in high and low TROAP groups. H RT-qPCR analysis of TROAP expression of mRNA in 6 paired fresh melanoma tissues (T) and matched adjacent normal tissues (N) quantifed after transfection. I Compared with HaCaT, TROAP was up-regulated in A375 and WM-115 melanoma cell lines. J RT-qPCR was performed to measure the relative expression of TROAP in transfected with sh-RNAs or negative control (NC). Note: *** P ≤ 0.001. ** P ≤ 0.01. * P ≤ 0.05

