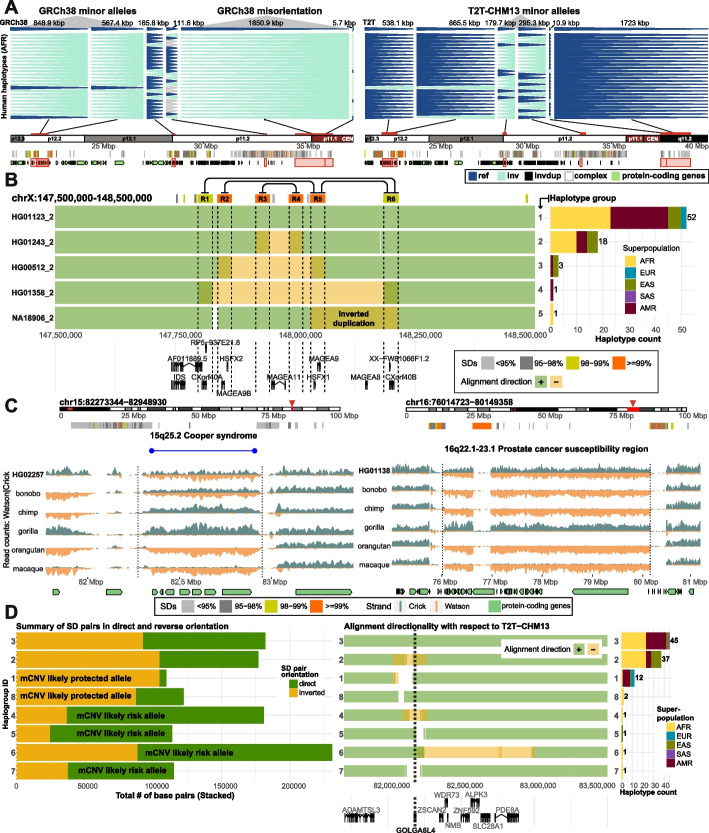
Fig. 2.
Improved representation of inversion polymorphisms in T2T-CHM13 and interpretation of TADs. A A “backgammon” plot for a 20 Mbp region at chromosome 16p depicting changes in the representation of major alleles as inverted (light blue) and direct (dark blue) orientation based on phased inversion genotypes reported with respect to GRCh38 and T2T-CHM13 reference genomes. Each horizontal set of arrowheads represents a single haplotype of African (AFR) ancestry. In most cases, GRCh38 was either erroneous or represented the minor allele. (See Additional file 1: Fig. S13 for all 82 haplotypes.) B Overlapping inversions on chromosome Xq28. Each row represents a unique human haplotype (haplotypes 1–5) of the Xq28 region visualized as a single human assembly aligned to T2T-CHM13 in forward ('+', green) or reverse ('-', orange) orientation. These aligned segments are displayed with respect to flanking segmental duplications (SDs) (R1-6) that likely mediate the inversions (connecting lines) and underlying protein-coding genes. We use transparency to convey positions of overlapping alignments, such as highlighted inverted duplication in haplotype 5. Barplot (right) shows the total counts of human haplotypes per haplotype group stratified by superpopulation. C Two disease-associated regions mapping to chromosomes 15q25.2 and 16q22.1–23.1 are depicted within chromosome-specific ideograms (red rectangle) with a zoom into the region flanked by SDs (colored horizontal bars) and pathogenic duplication and deletion breakpoints highlighted in blue and red horizontal lines, respectively. Strand-seq data highlight rare heterozygous inversions (see Fig. 1C for detailed description) discovered in a human sample with respect to the status in different nonhuman primate species. Homozygous inversions are orange while homozygous teal represents homozygous direct orientations. D Left plot summarizes the total number of base pairs for SD pairs in direct (dark green) and inverted (dark orange) orientatation for each haplogroup (in rows) marked as likely protected or at risk for morbid copy number variant (mCNV) formation. Middle plot shows unique human haplotypes (haplotypes 1–8) of the 15q25.2 region visualized as a single human assembly aligned to T2T-CHM13 in forward ('+', green) or reverse ('-', orange) orientation. Underlying protein-coding genes from this region are shown below. Barplot (right) shows the total counts of human haplotypes per haplotype group stratified by superpopulation

