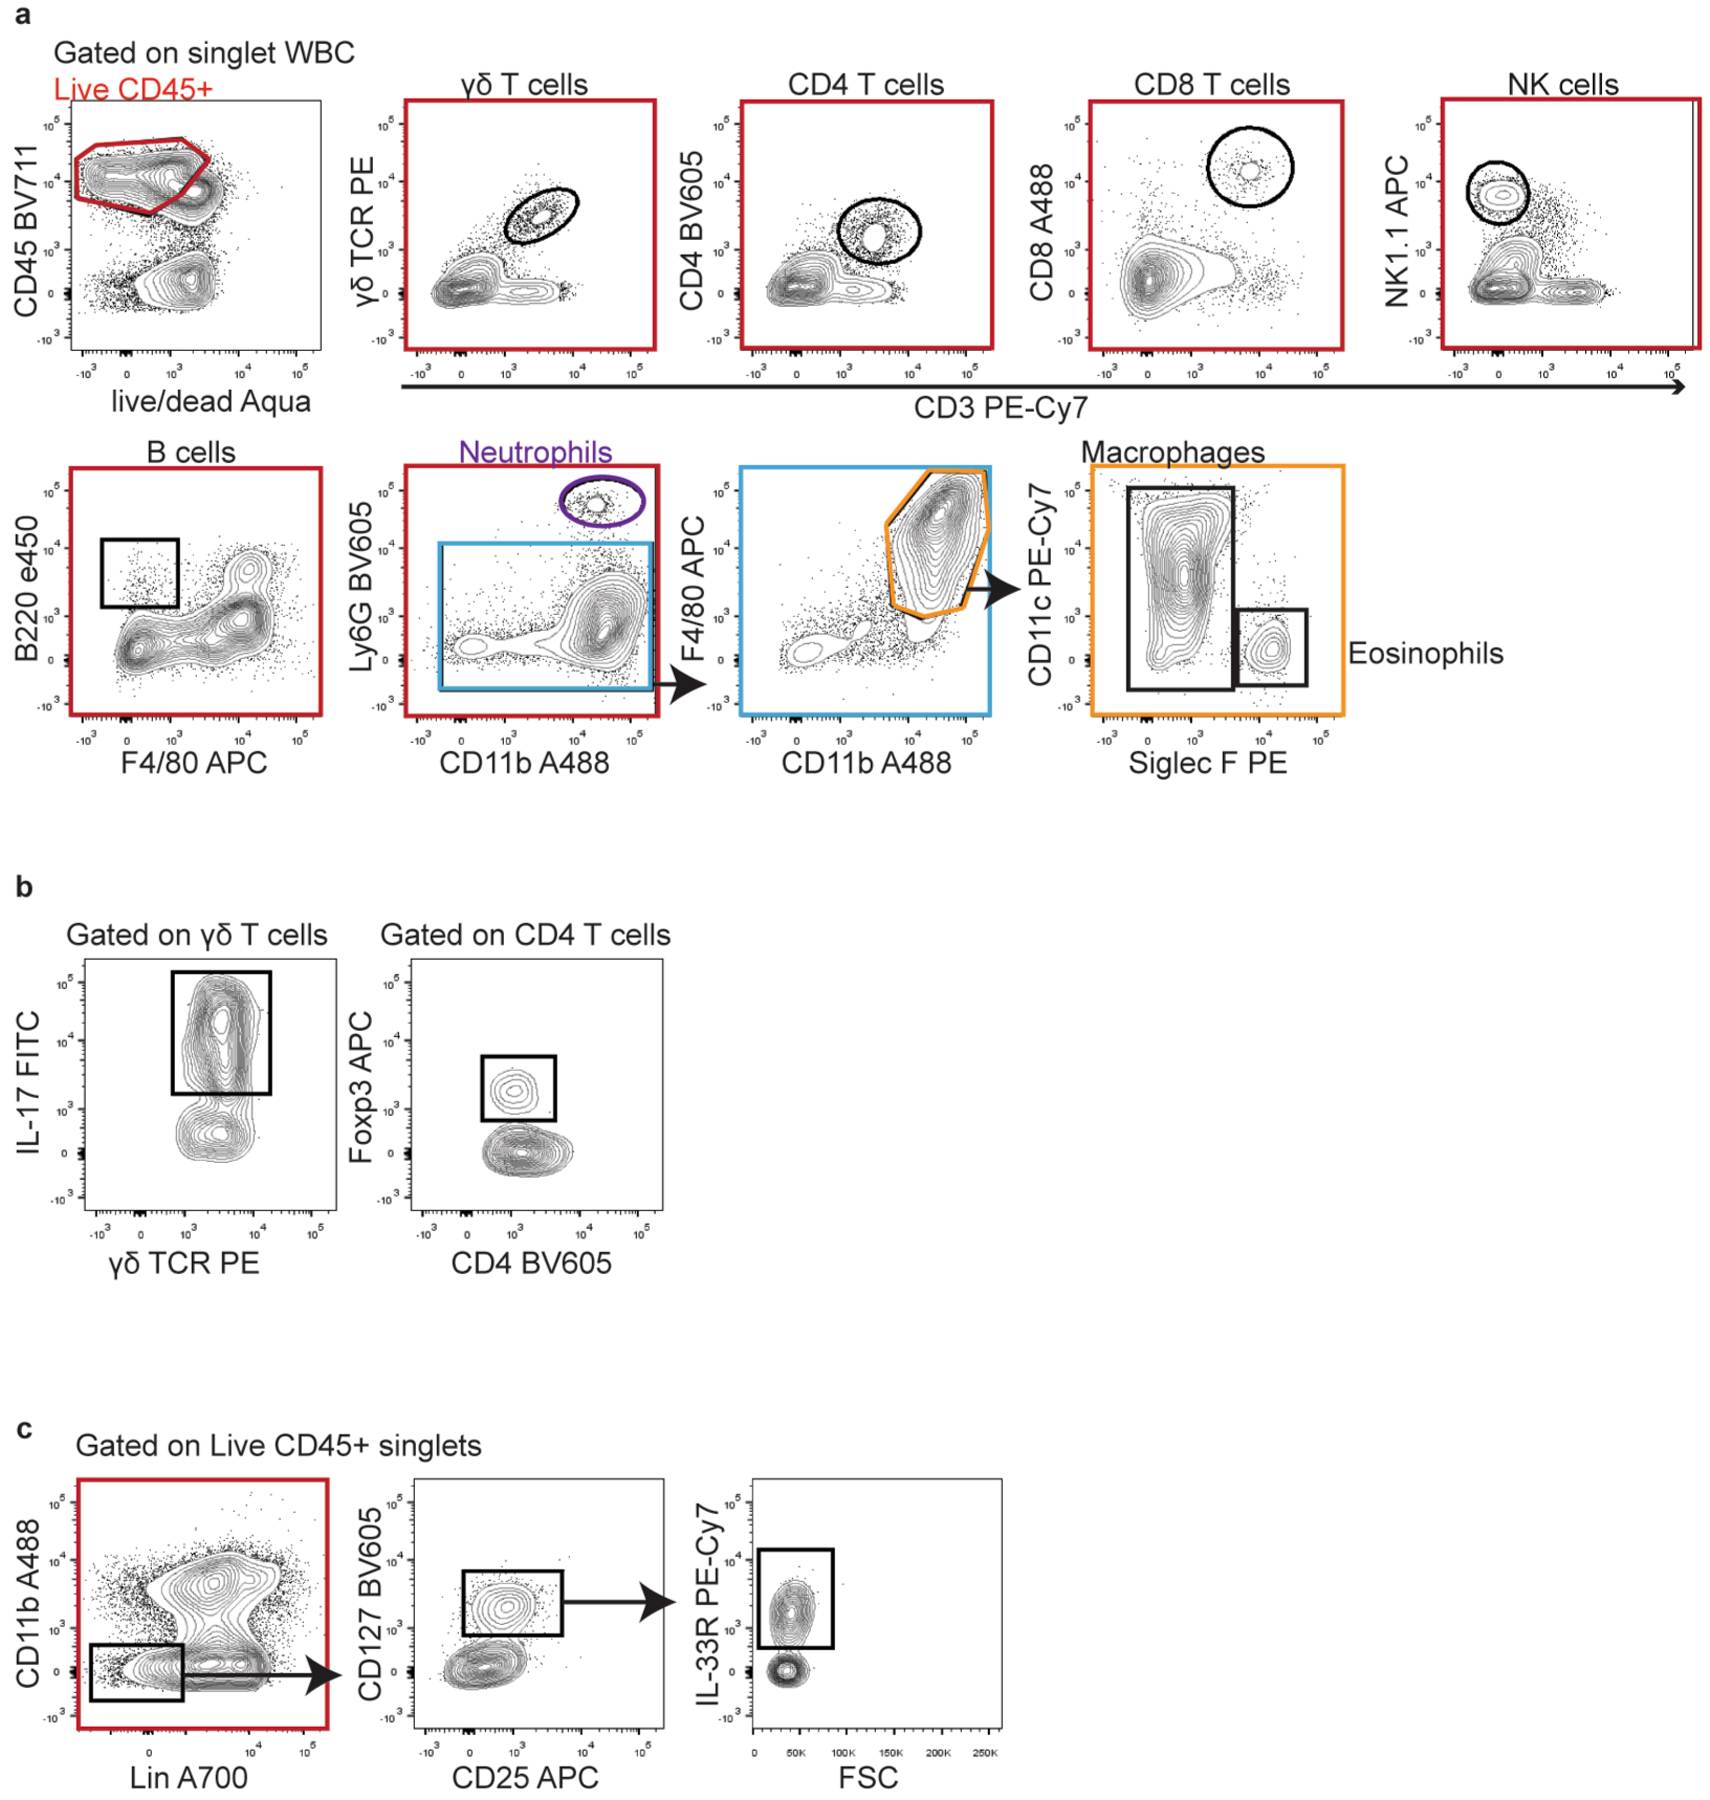
Extended Data Fig. 8 |. Flow cytometry gating strategies.

Representative gating strategies are shown for each cell population analyzed throughout the experiments. (a) Gating strategy used to define all cell lineages analyzed in Fig. 4d, Fig. 6e, f, o, Extended Data Fig. 3, Extended Data Fig. 4b, c, Extended Data Fig. 6g, Extended Data Fig. 7e, f. (b) Gating strategy used to identify IL-17-producing γδ T cells and Tregs analyzed in Fig. 4h, Fig. 6p. (c) Gating strategy used to identify ILC2 analyzed in Extended Data Fig. 7c.
