
Fig. 3 |. KD alters the adipose-resident immune compartment.
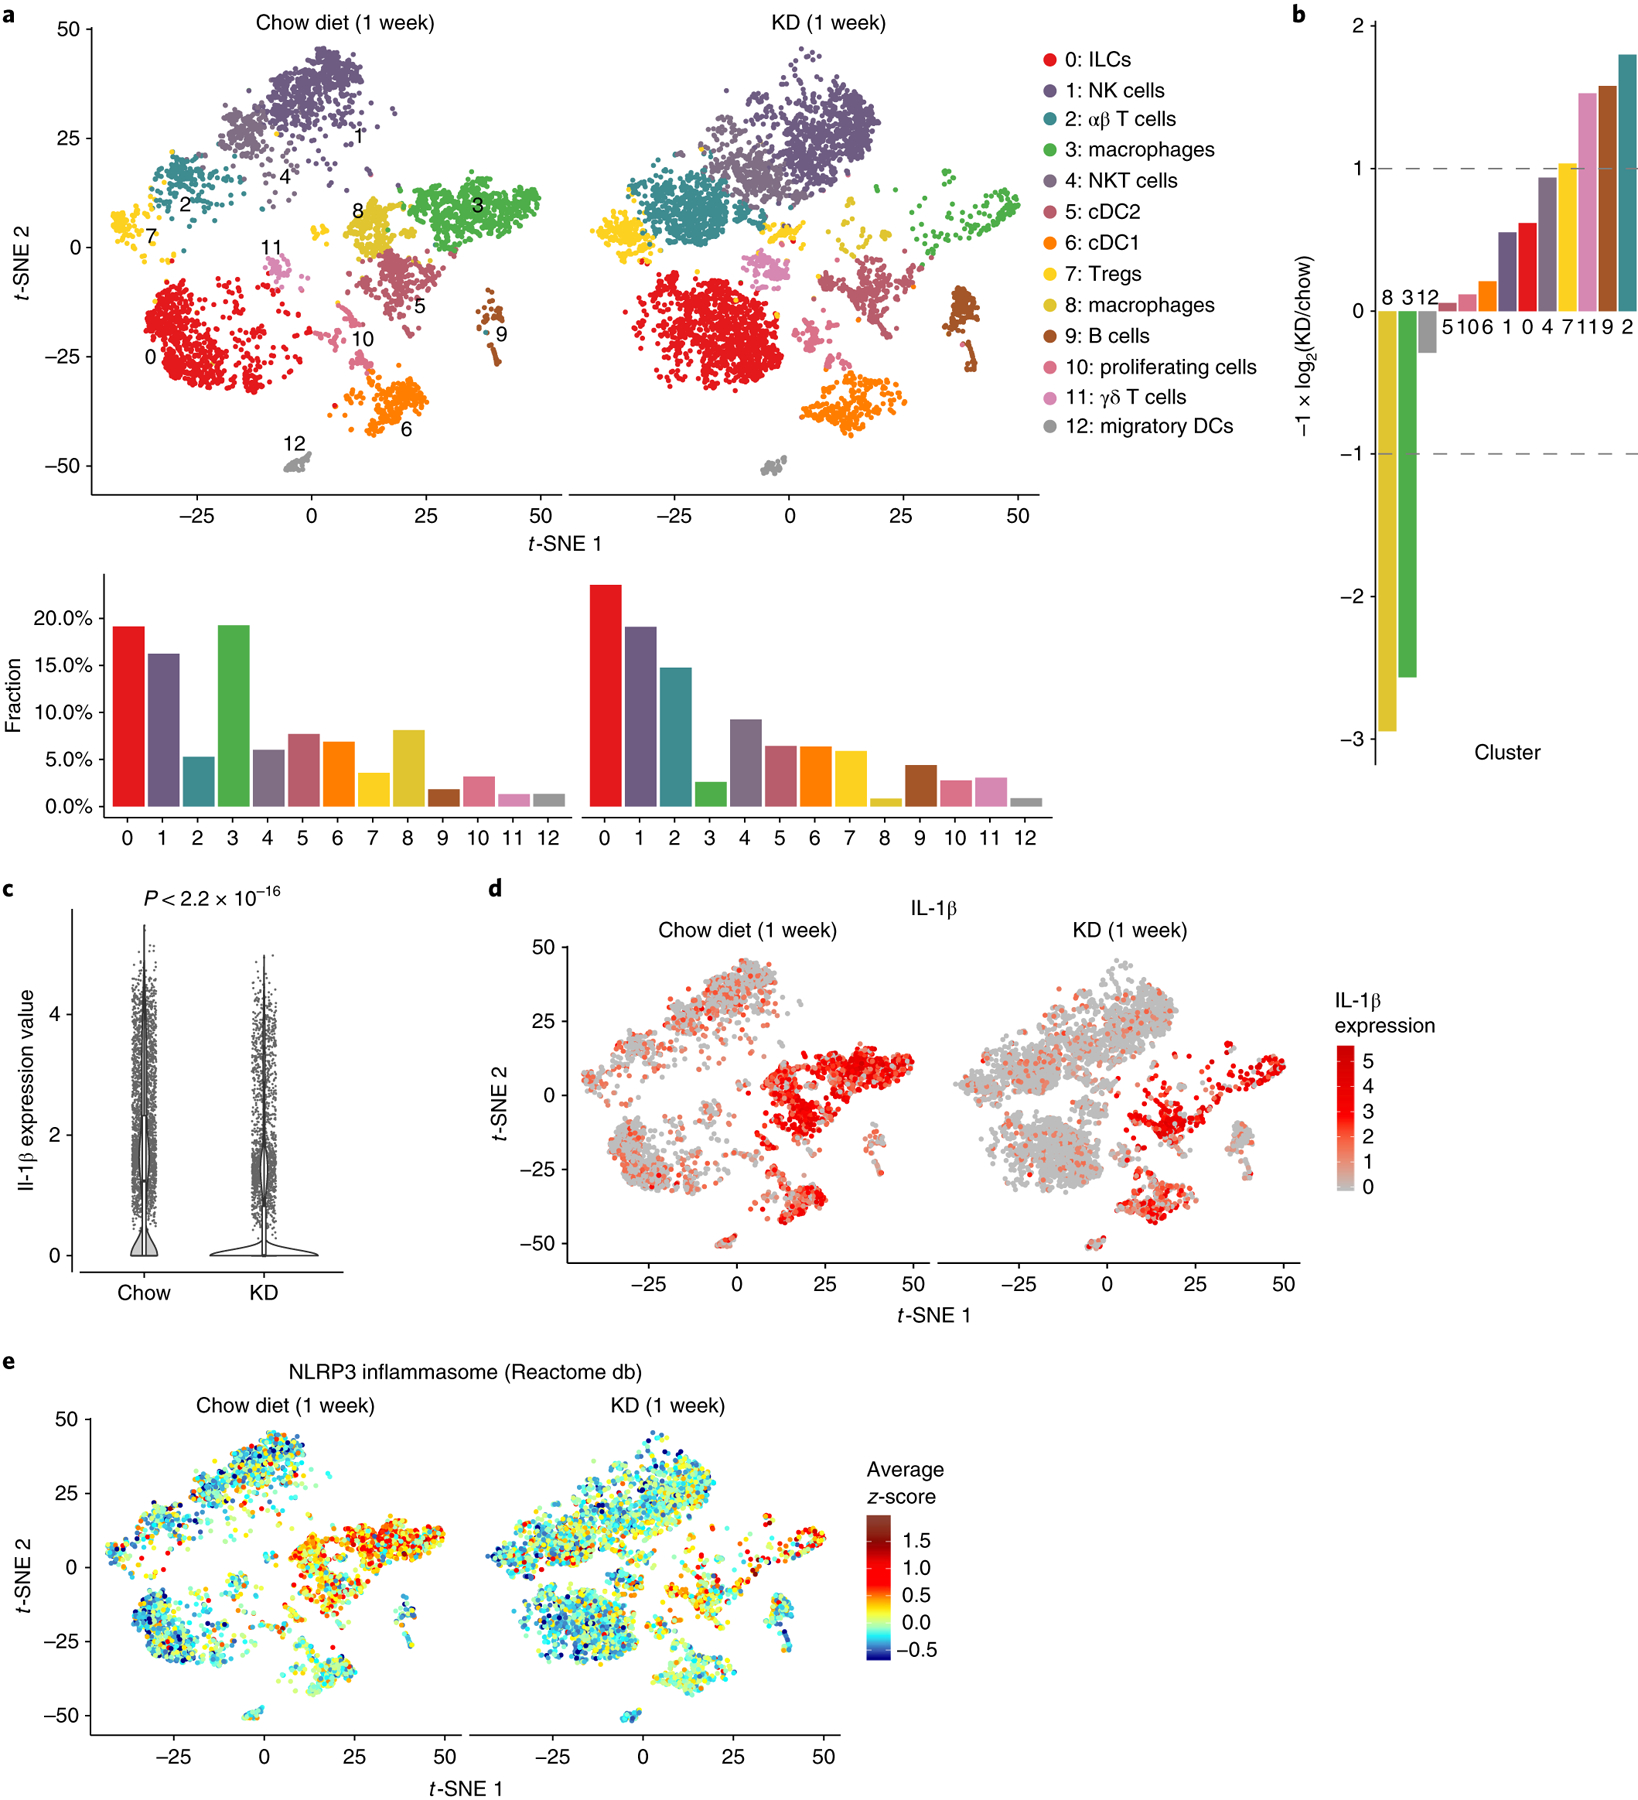
a, t-SNE plots (top) and bar charts (bottom) showing adipose-resident CD45+ populations from chow-fed or KD-fed mice. b, Bar chart showing population fold-changes in relative abundance of each cluster induced by 1 week of KD feeding compared to chow-fed mice. c, Violin plots of Il1b expression within all cells from each group. P value was calculated using two-sided Mann–Whitney U-test. Overlaid box plots show median and 25th–75th percentiles; whiskers extend no further than 1.5× IQR from either upper or lower hinge, as described in Methods. d, t-SNE plots as in a displaying expression of Il1b overlaid in red across all populations. e, t-SNE plot as in a showing average z-scores of genes in the NLRP3 pathway. For a–e, data represent a single technical sample for each diet group, generated by pooling n = 4 chow and n = 3 KD independent samples before sequencing.