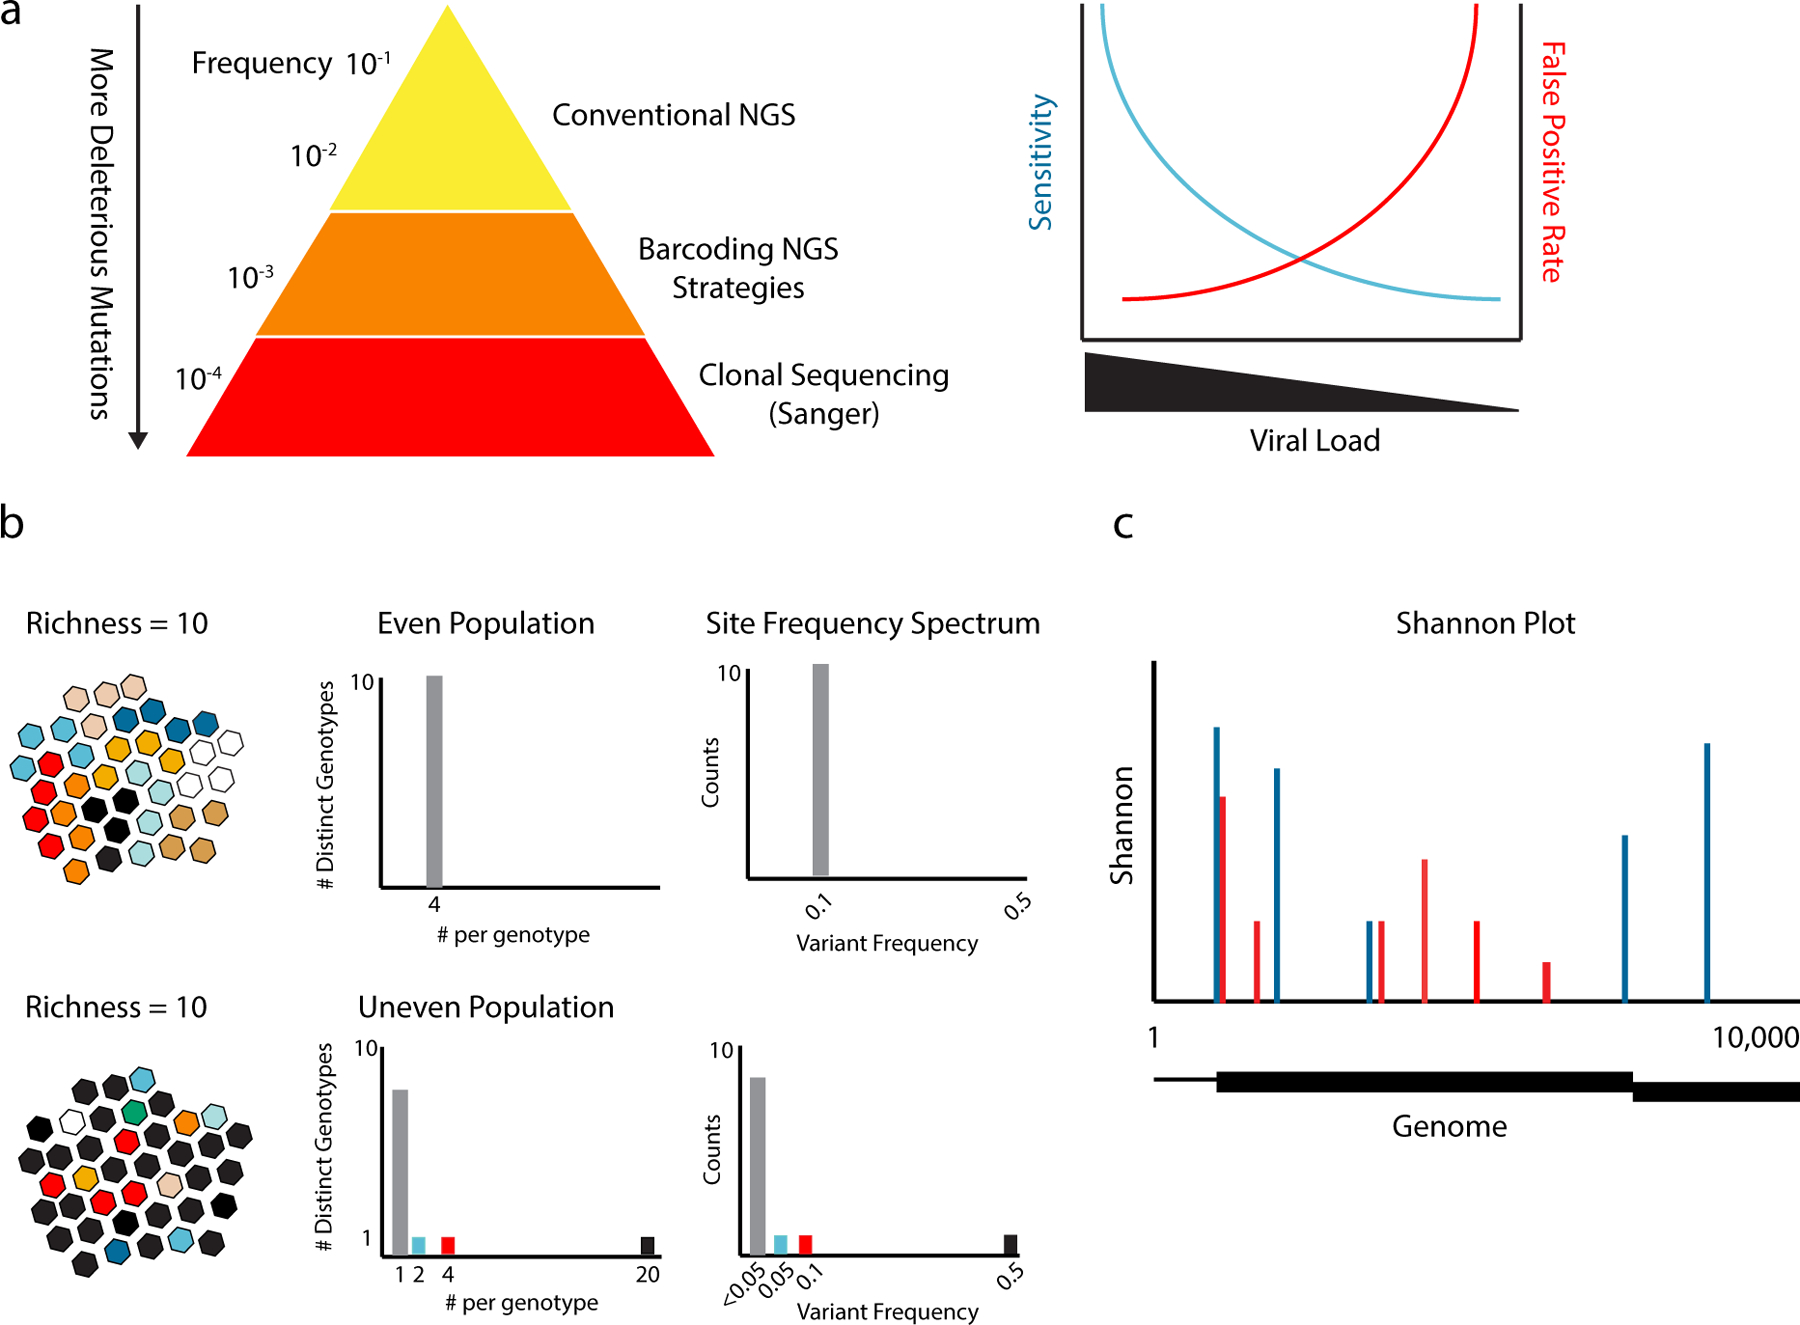
Figure 2.

Viral sequencing and diversity metrics. (a) Due to the negative impact of most mutations, the vast majority of sequence variants are relatively rare. The sensitivity and specificity of NGS for rare variant detection is highly dependent on the number of genomes sequenced and largely independent of read depth. Sensitivity drops at lower inputs, because rare variants can only be detected if the population is completely sampled. Smaller populations require more amplification, which propagates RT-PCR error. As a result, variants identified in low input populations are more likely to be false positives than true positives. (b) The diversity of two populations (different color viruses) expressed as richness, the number of variants or genotypes; evenness, the relative abundances of each variant in the population; and the site frequency spectrum, the numbers of different mutants and their respective frequencies. Both have a richness of 10 genotypes. The even population has equal numbers (n=4) of each genotype, and the 10 genotypes are present at a frequency of 0.1 (grey bars). The uneven population has the same 10 genotypes, but one is present at a frequency of 0.5 (black), one at 0.1 (red), and one at 0.05 (blue). The rest are singletons (summed as grey bars). (c) Shannon entropy at sites across a hypothetical 10 kilobase viral genome for two populations. In the genome, the noncoding regions are represented as lines and two different reading frames on the coding region are represented as boxes. The Shannon entropy at polymorphic sites for the two populations are shown as red and blue bars. Nonpolymorphic sites have an entropy of zero.
