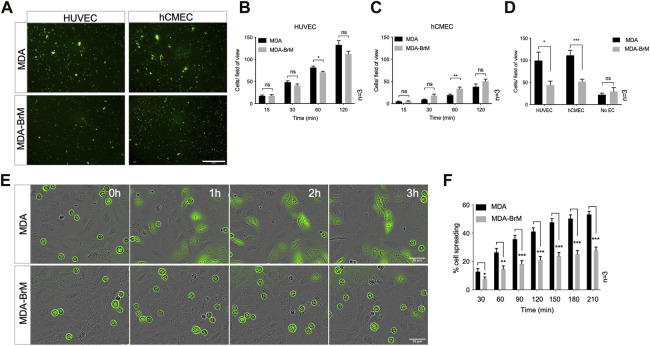
FIGURE 1.
Adhesion of breast cancer cells to endothelial cells. (A) Adhesion of CTG labelled breast cancer cell lines MDA-MB-231 (MDA) and brain metastatic variant (MDA-BrM) to HUVEC and hCMEC endothelial monolayers. Images show adhesion at the 60 min time point. Scale bar: 500 μm. (B) Quantification of adhesion of MDA and MDA-BrM to HUVEC monolayers for indicated time points. Data are derived from three independent experiments. Error bars indicate standard error of the mean (S.E.M). Analysis was performed using multiple unpaired T testing; *p < 0.05; ns, not significant. (C) Quantification of adhesion of MDA and MDA-BrM to hCMEC monolayers for indicated time points. Data are derived from three independent experiments. Error bars indicate S.E.M. Analysis was performed using multiple unpaired T testing; **p < 0.01; ns, not significant. (D) Quantification of TEM of CTG labelled MDA or MDA-BrM seeded to HUVEC and hCMEC monolayers grown in the upper chamber of a Boyden transwell insert, or an empty transwell insert for No EC condition. CTG cells that had migrated to the underside of the transwell filter were imaged and quantified 18 h post-seeding. Data are derived from three independent experiments. Error bars indicate S.E.M. Analysis was performed using unpaired T testing; *p < 0.05; ***p < 0.001, ns, not significant. (E) MDA and MDA-BrM intercalation determined by live cell imaging. MDA and MDA-BrM were CTG labelled and seeded to HUVEC monolayers and intercalation/spreading was captured using live cell imaging. Images were taken every 5 min for 3.5 h using a 20x objective. Scale bar: 50 μm. (F) Quantification of data in panel E, indicating the percentage of MDA or MDA-BrM cells that have undergone spreading/intercalation as a percentage of total cells. Data are derived from three independent experiments. Error bars indicate S.E.M. Analysis was performed using multiple unpaired T testing; *p < 0.05; **p < 0.01; ***p < 0.001.

