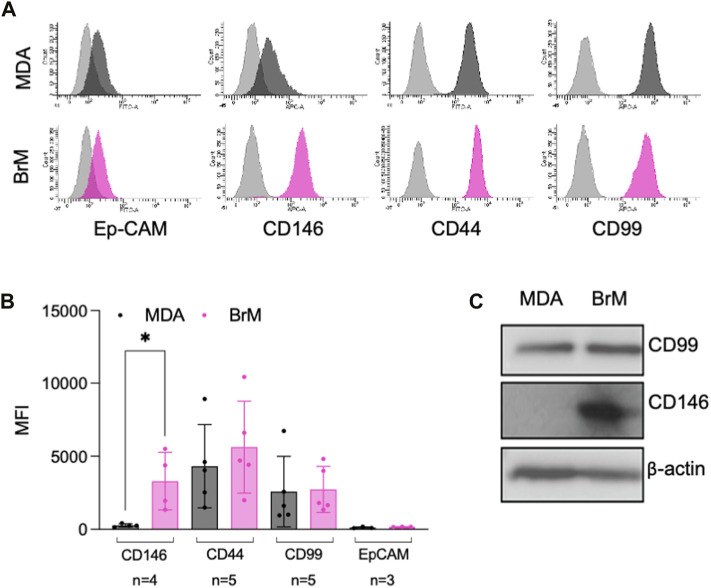
FIGURE 2.
MCAM is highly expressed by brain metastatic variant of breast cancer (A) Expression of cell surface CD146, CD44, CD99 and Ep-CAM on MDA (dark grey histograms) and MDA-BrM (pink histograms) determined by flow cytometry compared to the isotype control (light grey histograms). This data is representative of a minimum of 3 independent experiments. (B) Quantification of flow cytometry data shown in (A). The graph shows quantification of indicated receptor normalised to isotype controls with the number of independent experiments (n) used to measure expression of each antigen shown. Error bars indicate S.D. Analysis was performed using multiple unpaired T testing; *p < 0.05, ns, not significant. (C) Expression of total CD146 and CD99 protein expression determined by Western blotting in MDA and MDA-BrM using anti-CD146 and anti-CD99 antibody and anti-β actin as a loading control. This data is representative of two independent experiments.

