FIGURE 3.
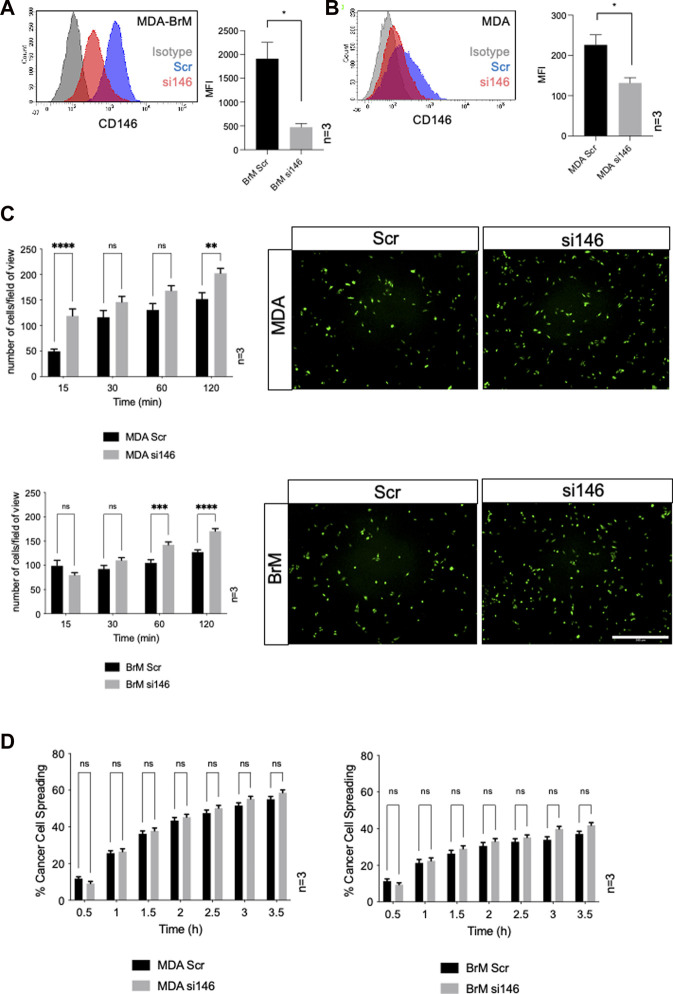
MCAM negatively regulates adhesion of breast cancer cells to endothelial cells (A) MDA-BrM cells were transiently transfected with siRNA targeting CD146 (si146) or a scrambled control siRNA (Scr), and CD146 expression was determined using flow cytometry 72–96 h post-transfection, compared to isotype control (grey histogram). For quantification, the mean fluorescence intensity (MFI) of CD146 expression in the Scr-treated cells was compared to si146-treated cells. Bar charts show data derived from three independent experiments. Error bars indicate S.D. Analysis was performed using an unpaired T-test; *p < 0.05. (B) Inhibition of CD146 expression in MDA cells, details as in (A). (C) Adhesion of siRNA transfected MDA (top panels) or MDA-BrM cells (lower panels) transfected with CD146 (si146) or scrambled (Scr) control siRNA to HUVEC monolayers for indicated time points. The graphs show data from three separate experiments, error bars indicate S.E.M. Data were analysed using multiple unpaired T tests; **p < 0.01; ***p < 0.001; ****p < 0.0001; ns, not significant. The images show adhesion of CTG labelled MDA or MDA-BrM transfected cells adhering to unlabelled HUVEC monolayers at the 60 min time point. Scale bar: 500 μm. (D) Quantification of MDA (left hand graph) and MDA-BrM (right hand graph) transfected with CD146 (si146) or scrambled (Scr) control siRNA and subsequent intercalation determined by live cell imaging. siRNA treated MDA and MDA-BrM were CTG labelled and seeded to HUVEC monolayers and intercalation/spreading was captured using live cell imaging. Quantification indicates the percentage of MDA or MDA-BrM cells that have undergone intercalation as a percentage of total cells. Images were taken every 5 min for 3.5 h using a 20x objective. Error bars indicate S.E.M. Data was derived from three independent experiments and analysed using multiple unpaired T tests; ns, not significant.

