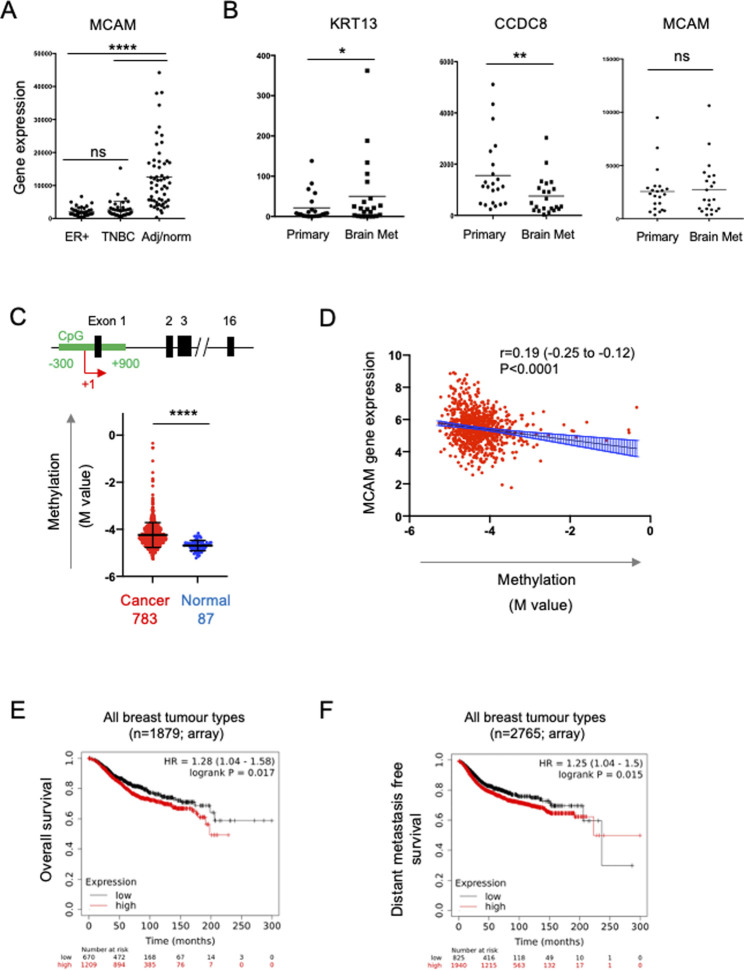
FIGURE 5.
Expression of the MCAM gene in breast cancer. (A) MCAM gene expression in ER + breast tumours (n = 42), TNBC tumours (n = 42), as well as adjacent/normal breast tissue (n = 56). Expression values were obtained from the data of Varley et al. (2014). Differences in expression between the pairs of samples indicated was analysed using a two-tailed Mann-Whitney test; ****p < 0.0001 or not significant (ns). Further analysis of these samples for ESR1, PGR, ERBB2 and EPCAM gene expression is shown in Supplementary Figure S1. (B) Expression of KRT13, CCDC8 and MCAM genes in 26 primary breast cancers and patient matched brain metastases; expression values were obtained from the data of Varešlija et al. (2019). Differences in expression between these samples was analysed using a two-tailed Wilcoxon matched-pairs signed rank test; *p < 0.05, **p < 0.01 or not significant (ns). (C) Methylation of a CpG island around the transcriptional start site (TSS; +1) of the MCAM gene. The diagram shows a representation of the MCAM gene, indicating the position of the CpG island (in green) relative to the exons (black) and the TSS (+1, red arrow). The graph shows the methylation (M value) in breast cancer and normal tissue samples (793 and 87 samples respectively, from TCGA) using data from nine probes across the CpG island. For each sample, we calculated the mean M value and compared these values in the tumour and normal tissue using a two-tailed Mann Whitney test; ****p < 0.0001. Data analysis and download was performed using SMART (Li et al., 2019). Methylation data for individual probes within the CpG island are shown in Supplementary Figure S2. (D) Correlation of MCAM methylation with MCAM gene expression (using TCGA data analysed via SMART). Spearman’s r, 95% confidence internals (and associated p-value) are shown together with the linear regression line and confidence intervals. (E) Kaplan-Meier analysis of overall survival in a cohort of 1879 breast cancer patients stratified for MCAM gene expression. (F) Kaplan-Meier analysis of distant metastasis free survival in a cohort of 2,765 patients containing all breast cancer types, stratified for MCAM gene expression. For (E,F), data was graphed and analysed and using KM plotter (Györffy et al., 2010).

