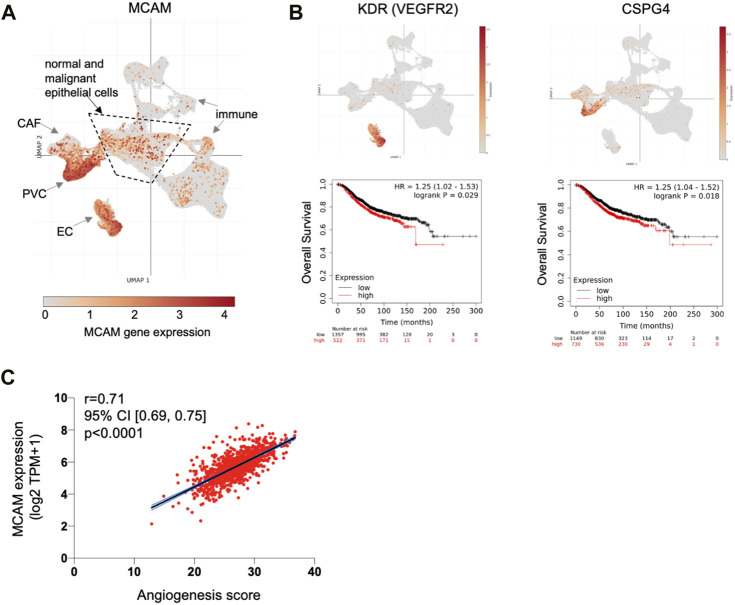
FIGURE 6.
MCAM gene expression at the single cell level in human breast cancer. (A) Uniform Manifold Approximation and Projection (UMAP) of a complete breast cancer scRNA-seq dataset comprising 100,064 cells from 26 patients. This data is from the study of Wu et al. (2021) with major cell populations indicated, as previously defined; these include immune cell types, cancer associated fibroblasts (CAF), endothelial cells (EC) and perivascular cells (PVC), as well as the epithelial cells (both malignant and normal) within the central area as indicated. Expression of MCAM is indicated and superimposed in orange. Data was displayed and analysed using Single Cell Portal. (B) UMAP of the complete sc-RNAseq dataset showing expression of the endothelial cell marker gene KDR (VEGFR2) and the PVC marker gene CSPG4 (superimposed in orange). Below each UMAP are Kaplan Meier plots showing overall survival in 1879 breast cancer patients stratified for KDR and CSPG4 gene expression, as determined using KM plotter (Györffy et al., 2010). (C) Correlation of angiogenesis score with MCAM gene expression across a cohort of 1,093 breast cancer patients from TCGA. Spearman’s r and the 95% confidence intervals (with associated p-value) are shown.

