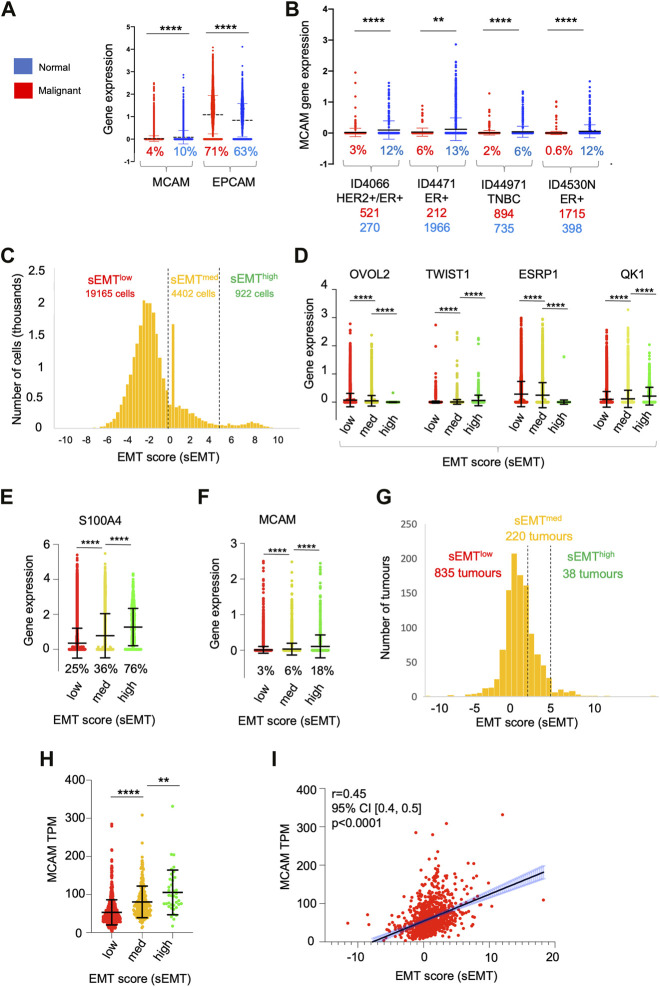
FIGURE 7.
Heterogeneity of gene expression in malignant cells. (A) MCAM and EPCAM gene expression in single malignant cells (red; n = 24,489) and single normal epithelial cells (blue; n = 4,355), as identified by Wu et al. (2021). Percentages indicate the proportion of expressing cells (expression > 0). Differences in expression were analysed using a two-tailed Mann Whitney test; ****p < 0.0001. (B) MCAM gene expression as in (A), except performed on four individual patients from the study. Anonymised patient IDs and the phenotype of their tumour (Wu et al., 2021) are shown along with the percentage of MCAM expressing cells in the malignant (red) and normal epithelium (blue). The number of malignant and normal epithelial cells in each tumour is also shown in red and blue respectively. Differences in expression were analysed using a two-tailed Mann Whitney test; **p < 0.01, ****p < 0.0001. (C) Population distribution of 22,489 malignant cells with respect to their EMT score (sEMT). The positions of the sEMTlow, sEMTmed and sEMThigh sub-populations are indicated, along with the number of cells in each sub-population. (D) Expression of EMT regulators in the sEMTlow, sEMTmed and sEMThigh sub-populations. Gene expression of the transcription factors OVOL2 and TWIST1 and the RNA splicing factors ESRP1 and QK1 are indicated. Data was analysed using a two-tailed Mann Whitney test; ****p < 0.0001. (E) Expression of the S100A4 gene in the sEMTlow, sEMTmed and sEMThigh populations. Data was analysed using a two tailed Mann Whitney test; ****p < 0.0001. (F) Expression of the MCAM gene in the sEMTlow, sEMTmed and sEMThigh populations. Data was analysed using a two-tailed Mann Whitney test; ****p < 0.0001. (G) Population distribution of 1,093 tumours (from TCGA) with respect to their EMT score (sEMT × 10−3) The positions of the sEMTlow, sEMTmed and sEMThigh tumours are indicated, along with the numbers of tumours in each group. The sEMT groups were defined as follows; sEMTlow=sEMT<2,000, sEMTmed=sEMT<5,000, sEMThigh=sEMT>5,000. (H) Expression of the MCAM gene in the 1,093 breast cancer tumours from TCGA defined as sEMTlow, sEMTmed or sEMThigh tumours. Differences in expression were analysed using a two-tailed Mann Whitney test; **p < 0.01, ****p < 0.0001. (I) Correlation of MCAM gene expression and sEMT for the in the 1,093 breast cancer tumours from TCGA. Spearman’s r, confidence intervals (and associated p-value) are indicated.

