FIGURE 2.
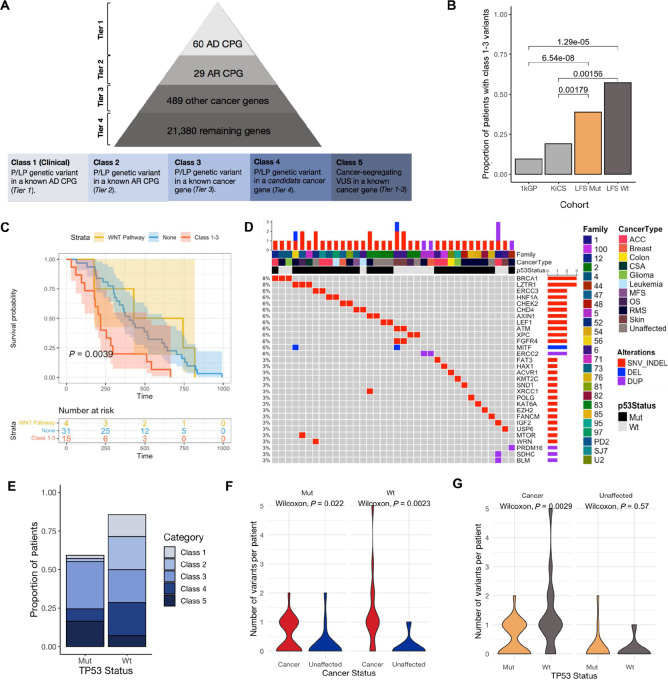
Germline genetic variants in LFS. A, Classification scheme for genetic variants identified from WGS. The pyramid (top) shows how genes were prioritized into four tiers from highest known cancer predisposition potential to lowest. All variants were then classified using a Cancer Variant Classification Schema (Materials and Methods) into five classes (bottom) based on pathogenicity and whether the gene fell into Tier 1–4. AD: autosomal dominant; AR: autosomal recessive; CPG: cancer predisposition gene. B, Frequency of P/LP variants in known cancer genes (class 1–3) in LFS, KiCS and 1kGP. Fisher exact test P values for comparisons between the LFS cohorts and KiCS/1kGP shown. C, Kaplan–Meier survival curve comparing patients with P/LP variants in the WNT signaling pathway (yellow), patients with at least one class 1–3 variant (red) and patients with neither WNT signaling or class 1–3 variants (blue). D, Landscape of genetic alterations in cancer genes (class 1–3) in LFS. Annotated with family, cancer type and TP53 variant status. Genetic variants are indicated as a deletion (blue), SNV or indel (red) or duplication (purple). E, The proportion of individuals in the wildtype and variant TP53 cohorts with classes 1–5 variants (Materials and Methods). F, The number of P/LP variants in cancer genes (class 1–3) in individuals that developed cancer compared with unaffected individuals, stratified by TP53 status. G, The number of P/LP variants (class 1–3) in wildtype versus variant TP53 carriers, stratified by cancer status. On the basis of the premise that variants in the WNT signaling pathway are associated with decreased cancer incidence in LFS, these variants were removed from the comparisons made in F and G.

