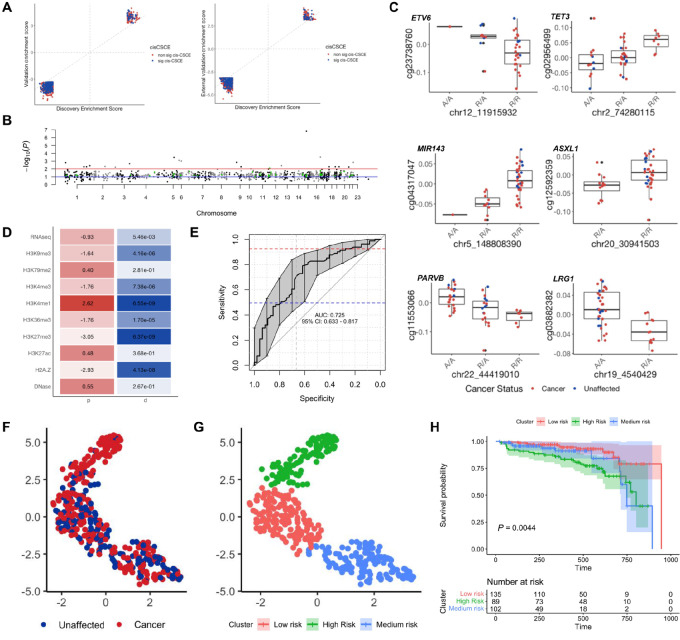
FIGURE 4.
Secondary constitutional epimutations in LFS. A, Concordance between enrichment scores of 931 EWAS probes found significantly associated with cancer status in the discovery cohort and the validation cohort, for both the internal (left) and external (right) validation cohort. Blue = associated with cancer status and a cis-CSCE; Red = associated with cancer status but not a cis-CSCE. B, Manhattan plot of adjusted P values from meQTL association tests between the 931 EWAS probes and their most correlated rsSNP. Red line: FDR = 0.1; Blue line: FDR = 0.01; Green points: probes in cancer genes with FDR < 0.1. C, Top cis-CSCE in ETV6, TET3, MIR143, ASXL1, PARVB, and LRG1.D, Feature enrichment heatmap of the 259 significant cis-CSCE loci showing adjusted P value (p) and effect size (d). E, ROC curve of the epimutation cancer risk model on the test set. F, UMAP projection of methylation at 259 cis-CSCE for all patients, colored by cancer status. G, UMAP projection of methylation at 259 cis-CSCE for all patients, colored by clusters associated with risk. H, Kaplan–Meier survival curve demonstrating significant differences in survival probability between the three epimutation clusters.

