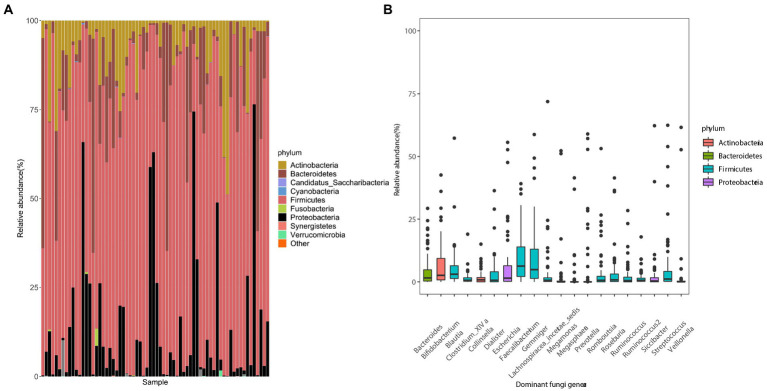
Figure 1.
Composition of gut microbes and the average abundances of dominant bacterial genera in young adults. (A) Composition of the gut microbiota at the phylum level. (B) Composition of dominant bacterial genera (mean relative abundance >0.1%). The color corresponds to the name of each species at the particular taxonomic level and the width of the color block indicates the relative abundance.

