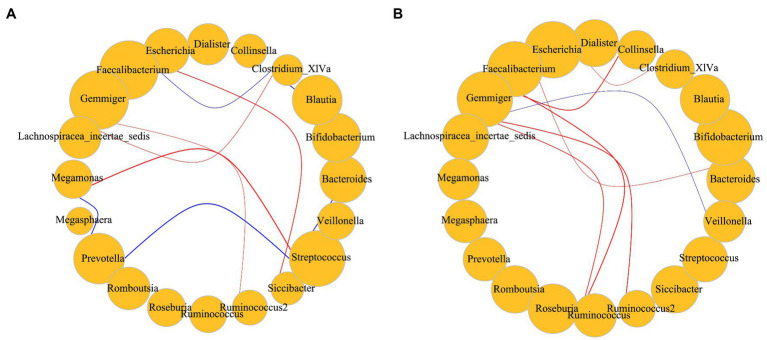
Figure 6.
(A) Correlations among dominant bacteria in subjects with BMI < 28; (B) Correlations among dominant bacteria in subjects with BMI > 28. Red represents a positive correlation; blue represents a negative correlation. Size represents the relative abundance of the genus, including only dominant bacteria. The p value for significant correlations are less than 0.05 and the absolute value of the correlation distance calculated by the Spearman method is greater than 0.45. Correlation of the gut microbiota was analyzed using the Hmisc package and igraph package in R v4.1.3.

