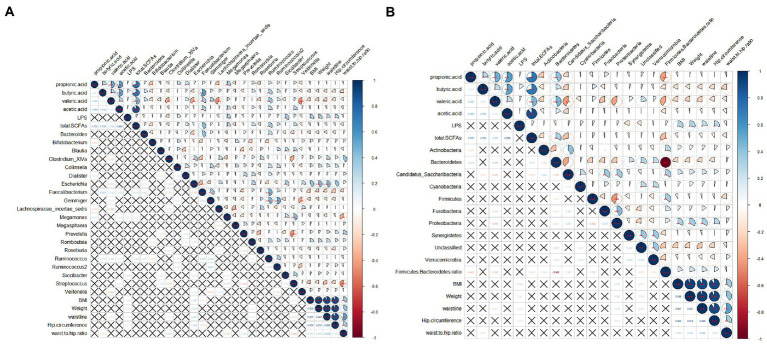
Figure 9.
Correlation analysis among obesity indicators, gut microbes, SCFAs, and LPS. (A) Correlation between abundances of dominant bacterial genera and other indicators; (B) Correlations between abundances of gut microbes at the phylum level and other indicators. The pie chart on the upper right indicates the magnitude of the correlation, with a star indicating significance; the bottom left indicates the correlation coefficient. A cross indicates that the correlation is not significant. Spearman was used to test for correlation.

