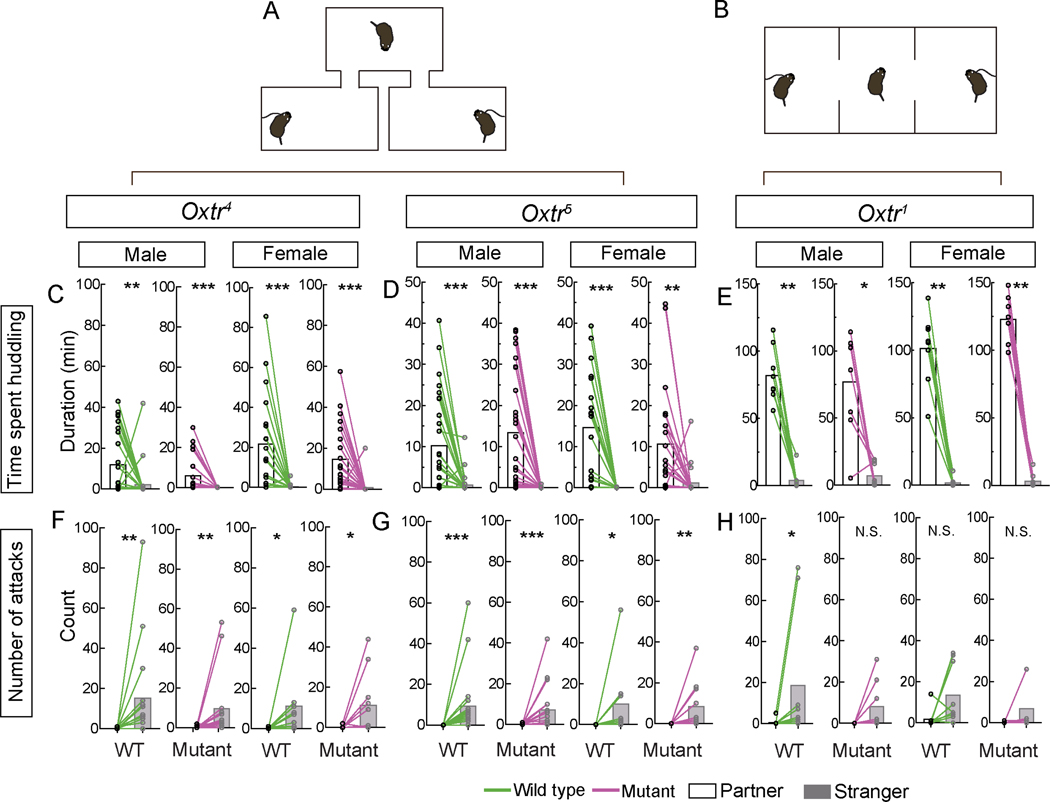
Figure 3. Female and male prairie voles lacking Oxtr exhibit pair bonding Scale bar =5 mm; boxplot depicts max-min.
A-B. Schematic of partner preference test performed in a branched (A) or linear chamber with two partitions (B). Experimental vole is free to move between chambers (A) or partitioned space (B) whereas stimulus voles (opposite sex partner and stranger) are restrained by tethers. Scale bar =5 mm; boxplot depicts max-min
C-E. WT, Oxtr4−/− (C), Oxtr5−/− (D), and Oxtr1−/− (E) voles spent more time with their partner than a stranger of the opposite sex.
F-H. WT, Oxtr4−/− (F), and Oxtr5−/− (G) voles attacked the stranger more frequently than their partner. WT Oxtr1 males attacked the stranger more frequently (H).
Mean ± SEM; n = 25 WT and 21 mutant males, 19 WT and 21 mutant females (C); 27 WT and mutant males each, 19 WT and 21 mutant females (D); 8 WT and 8 mutant males, 8 WT and 8 mutant females each (E); 15 WT and 14 mutant males, 9 WT and 11 mutant females (F); 18 WT and mutant males each, 9 WT and 12 mutant females 15 (G); 8 WT and mutant males and females each (H); *p<0.05, **p<0.01, ***p<0.001; N.S., not significant.
See also Figure S3.

