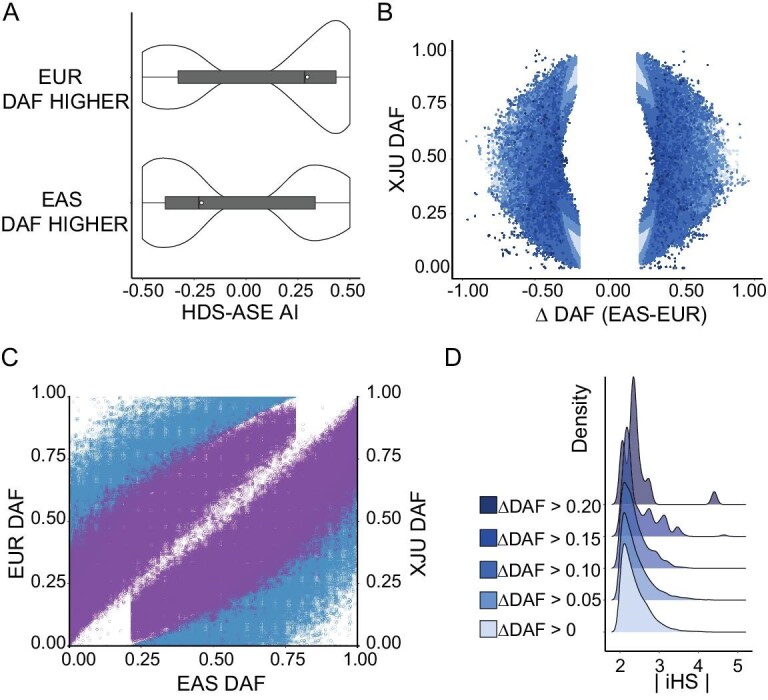
Figure 1.

Properties of HDSs detected in XJU. (A) Comparison of the AI of HDS-ASE. The HDS-ASE were divided into two groups by derived allele frequency (DAF). If the allele frequency of the derived allele of ASE was higher in EUR, then the allele would be regarded as a western origin allele with a high probability (labeled as EUR DAF HIGHER in the figure). If the allele frequency of the derived allele of ASE was higher in EAS, the allele would be regarded as an eastern origin allele with a high probability (labeled as EAS DAF HIGHER in the figure). The x-axis indicates the AI levels. The ‘+’ indicates that the derived alleles were highly expressed, and the ‘−’ indicates that the ancestral alleles were highly expressed. (B) DAF distribution of HDSs. The x-axis indicates the frequency differences between EAS and EUR ( ), and the y-axis indicates the DAF in XJU. Each dot reflects one SNP. The colors of dots denote the frequency deviation degree measured as
 (Materials and Methods). (C) HDS DAF distribution in XJU with its ancestral source populations. Each dot indicates one SNP in HDSs. The colors of the dots indicate the mapping to the y-axis. The color blue indicates the allele frequency distribution between EAS and EUR, and the color purple indicates the allele frequency distribution between EAS and XJU. (D) A density plot of HDS integrated haplotype score (iHS) with R package ‘ggridges’ [68]. (See online supplementary material for a colour version of this figure).
