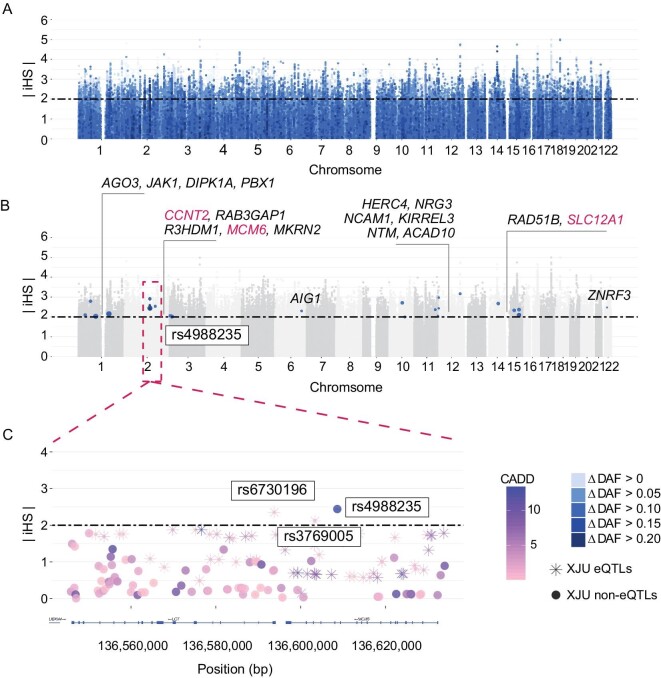
Figure 2.
Distribution of iHS in HDSs. (A) Manhattan plots exhibiting the distribution of iHS. Each dot indicates one SNP of HDSs. The x-axis indicated the positions of the SNPs on chromosomes. The y-axis indicates the absolute iHS score. The colors of the dots indicate the degree of frequency deviation in XJU. (B) Distribution of HDSs with high-frequency deviation and potential functions. We labeled the SNP-located genes in the figure. (C) Zoomed-in region of rs4988235. All variants with this region were plotted and coordinated with positions. The genes were labeled by LocusZoom [69]. (See online supplementary material for a colour version of this figure).

