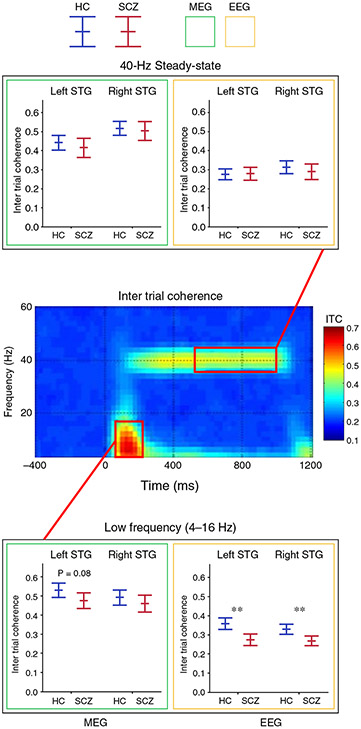
Fig.4.
Intertrial coherence time-frequency plots (grand average of controls shown) with box plots (magnetoencephalography [MEG] = green border, electroencephalography [EEG] = yellow border) showing the mean and 95% confidence intervals for each group (healthy controls (HC) = blue, schizophrenia (SCZ) patients = red), and for the total sample (younger and older). Findings shown for left and right superior temporal gyrus (STG) poststimulus low-frequency activity (4–16-Hz activity averaged from 50 to 200 ms) and 40-Hz steady-state activity (38–42-Hz activity averaged from 500 to 1000 ms). In the box plots, significant group differences are indicated. *P < 0.05, **P < 0.001, trends below P = 0.10 reported with P-value.

