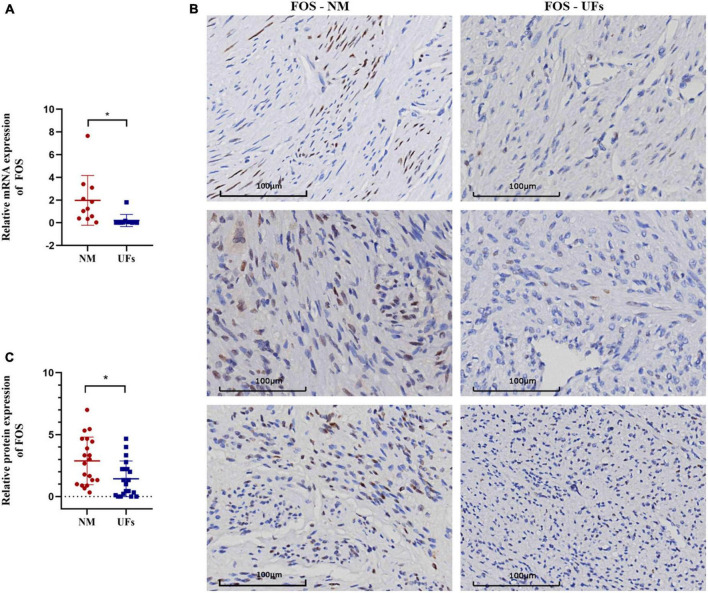
FIGURE 5.
The expression of FOC in fibroid and normal myometrium tissue. (A) The relative expression of FOS in the mRNA level. (B) Immunohistochemical results of typical samples from two groups, all images were presented at 20-X. (C) IHC score. NM, normal myometrium, UFs, uterine fibroids. *P < 0.05.

