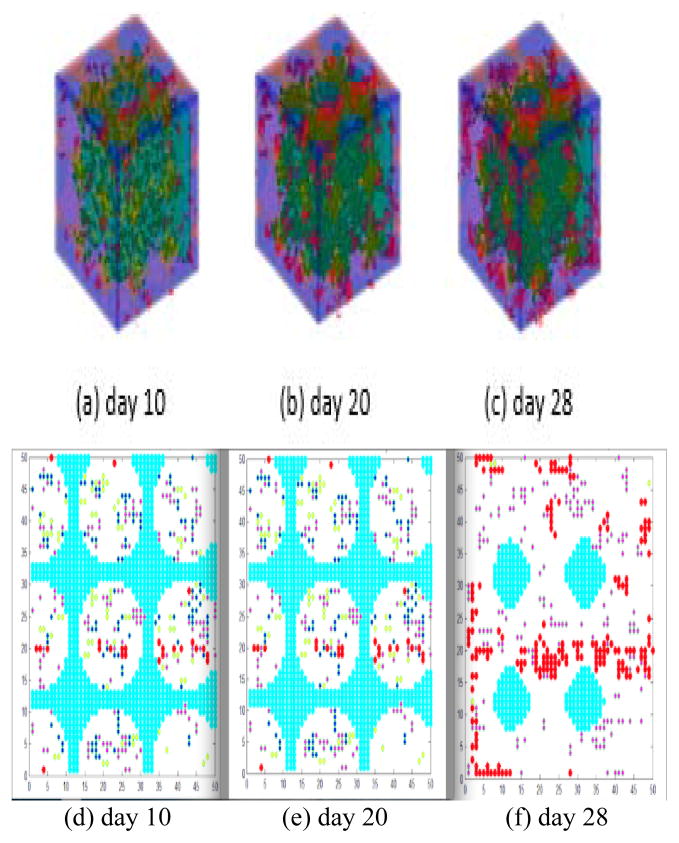
Figure 3.
3D bone formation and 2D slices of bone formation over time. (a), (b) and (c) show the 3D model under mechanical stimulation on days 10, 20 and 28, respectively. (d), (e) and (f) show 2D slices of bone formation on days 10, 20 and 28, respectively. The porous CaP scaffold, MSC, OBa, angiogenesis and pore structure are colored cyan, yellow, blue, red and white, respectively.

