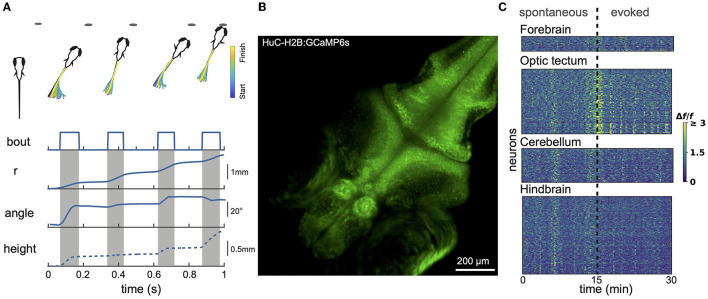
Figure 1.
Larval zebrafish behavior and neural activity imaging. (A) Example hunting sequence. Also shown are total displacement (r), heading angle and z-depth (height). r and angle data were recorded in 2D for the hunting event shown above; height data was estimated based on data from similar events recorded in 3D by others (Bolton et al., 2019). (B) Example maximum projection image of volumetric 1-photon light sheet recording of a GCaMP6s 9 dpf fish imaged at 1 Hz. 15 planes were captured spanning a total z-range of 150 μm. (C) Calcium signals measured using light sheet recording during spontaneous activity and in response to presentation of prey-like stimuli. Different brain regions captured simultaneously show both synchronized and region-specific activity patterns.

