
Figure 3.
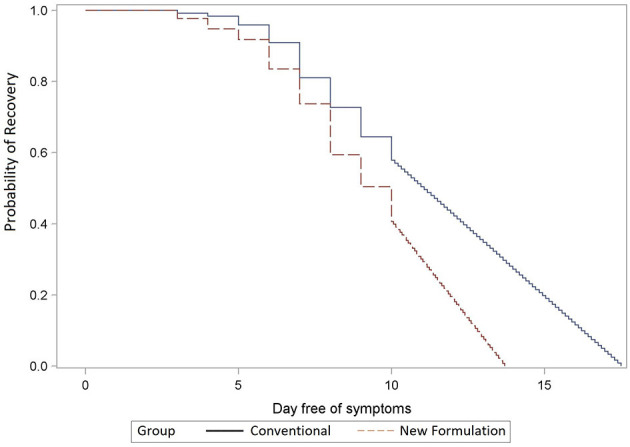
Remission of all infection episodes extrapolated until full recovery. Comparison of recovery times of new (dashed line, A + B) vs. conventional (solid line, C + D) (p < 0.001) formulations extrapolated beyond day 10 to absent symptoms; y-axis: the probability of recovery; x-axis: day free of symptoms; the Kaplan–Meier analysis.