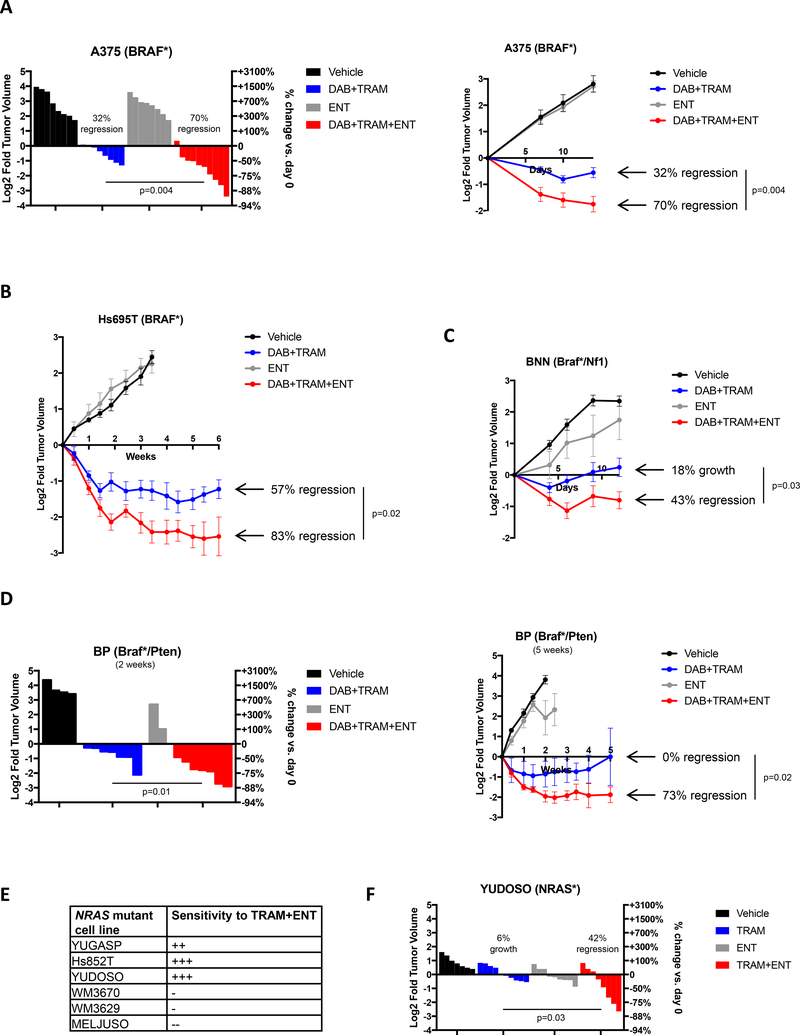
Figure 2: Entinostat improves the efficacy of BRAF/MEK pathway inhibitors in vivo.
(A) Waterfall plot (left panel) depicting change in tumor volume in a BRAF-mutant melanoma xenograft model (A375 cells) after 2 weeks of treatment with single and combined agents as indicated. Each bar represents an individual tumor (Vehicle n=9, DAB+TRAM n=8, ENT n=8, DAB+TRAM+ENT n=10). Left axis indicates the log2 of fold change in tumor volume, and right axis indicates the percentage change in tumor volume relative to day 0. Dabrafenib (DAB, BRAF inhibitor), trametinib (TRAM, MEK inhibitor), entinostat (ENT, Class I HDAC inhibitor). Growth curve for the entire duration of the study is shown on the right. Graphs represent mean values +/− standard error of the mean. (B) Growth curve of an additional human BRAF-mutant melanoma xenograft model (Hs695T) treated with single and combined agents as indicated (Vehicle n=6, DAB+TRAM n=8, ENT n=6, DAB+TRAM+ENT n=8). Left axis indicates the log2 of fold change in tumor volume relative to day 0. Graphs represent mean values +/− standard error of the mean. (C) Growth curve depicting change in tumor volume of GEMM-derived Braf/Nf1-mutant melanoma allografts after treatment with single and combined agents as indicated. (Braf/Nf1: Vehicle n=7, DAB+TRAM n=6, ENT n=6, DAB+TRAM+ENT n=5). Graphs represent mean values +/− standard error of the mean. (D) Waterfall plot (left panel) depicting change in tumor volume in a Braf/Pten-mutant melanoma allograft model after 2 weeks of treatment with single and combined agents as indicated. Each bar represents an individual tumor (Vehicle n=4, DAB+TRAM n=7, ENT n=2, DAB+TRAM+ENT n=7). Growth curve for the entire duration of the study is shown on the right. Graphs represent mean values +/− standard error of the mean. (E) Table summarizing in vitro sensitivity of 6 human NRAS-mutant cell lines against combined trametinib and entinostat treatment. (F) Waterfall plot depicting change in tumor volume of NRAS-mutant melanoma xenografts (YUDOSO cells) treated with single and combined agents as indicated (Vehicle n=7, TRAM n=9, ENT n=9, TRAM+ENT n=8). Each bar represents an individual tumor.

