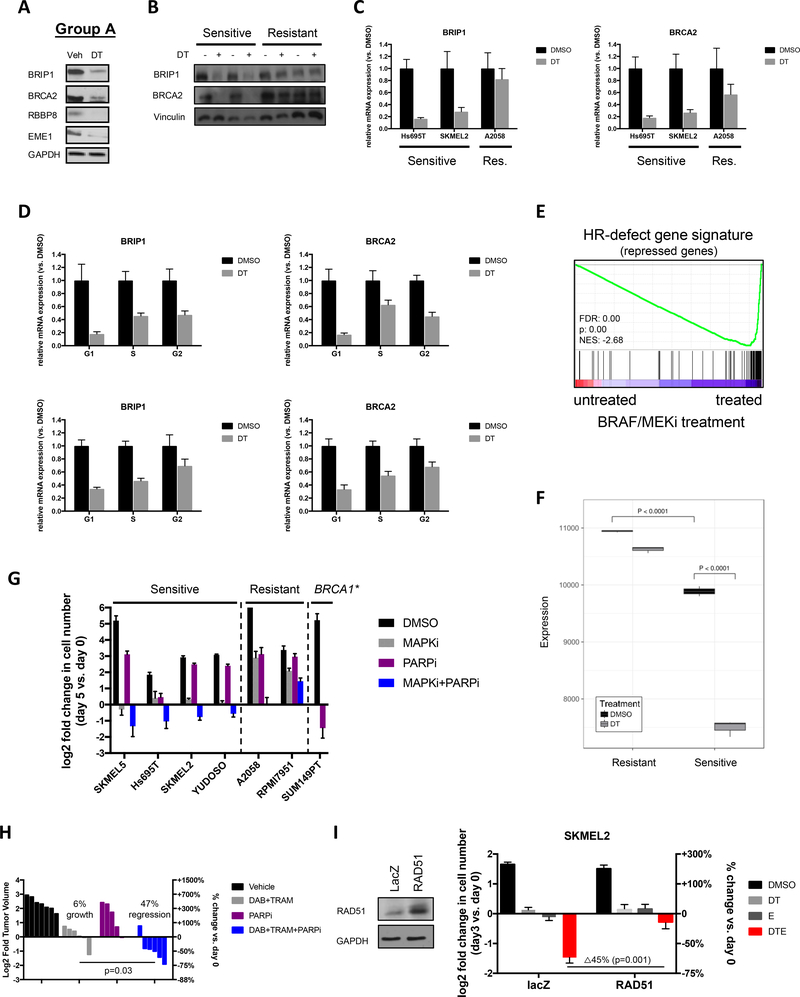
Figure 5: MAPK pathway inhibitors potently reduce the expression of HR pathway genes in sensitive melanomas.
(A) Western blot depicting BRIP1, BRCA2, RBBP8 and EME1 protein levels in Hs695T cells after 48hrs of treatment with vehicle (Veh) or 100nM dabrafenib and 10nM trametinib (DT). GAPDH serves as a loading control. (B) Western blot depicting BRIP1 and BRCA2 protein levels in sensitive (Hs695T and SKMEL2) and resistant (A2058 and RPMI7951) cells after 48hrs of treatment with vehicle (Veh) or 100nM dabrafenib and 10nM trametinib (DT). GAPDH serves as a loading control. (C) mRNA levels of BRIP1 and BRCA2 in sensitive (Hs695T and SKMEL2) and resistant (A2058) cells after 24 hours of treatment with vehicle (Veh) or 100nM dabrafenib and 10nM trametinib (DT) as determined by quantitative PCR. (D) Cells from 2 sensitive cell lines (top and bottom panels, respectively) were separated in different phases of the cell cycle for subsequent gene expression analysis. Bar graphs show mRNA expression of BRCA2 and BRIP1 in specific cell subpopulations after 24 hours of treatment with Vehicle (Veh) or 100nM dabrafenib and 10nM trametinib (DT). (E) Plot of Gene Set Enrichment Analysis (GSEA) showing suppression of HRD associated genes (29) in melanoma cells in response to trametinib (10nM) and dabrafenib (100nM). Note: The HRD gene signature is a compilation of genes that are significantly suppressed after single-gene ablation of HR components (29). Cells treated with BRAF/MEKi show a reduction of these same genes. FDR: false discovery rate, NES: normalized enrichment score. (F) Single Sample Gene Set Enrichment Analysis (ssGSEA) depicting the relative expression of HRD signature genes in response to dabrafenib/trametinib (DT) treatment in sensitive and resistant cell lines. Note: The HRD gene signature is a compilation of genes that are significantly suppressed after single-gene ablation of HR components (29). (G) Sensitive cells (SKMEL5, Hs695T, SKMEL2 and YUDOSO) and resistant cells (A2058 and RPMI7951) were treated with DMSO, 100nM dabrafenib/10nM trametinib (DT), 5μM olaparib (PARP inhibitor) or the combination of DT + PARP inhibitor. As a positive control the BRCA1-mutant breast cancer cell line SUM149PT was treated with the PARP inhibitor. Cells were manually counted prior to the addition of compounds and 5 days after treatment. Graphs represent log2 transformation of the fold change in cell number at day 5 versus day 0. Negative values represent a net loss of cells. (H) Waterfall plot depicting change in tumor volume in a Braf/Nf1-mutant melanoma allograft model after 9 days of treatment with single and combined agents as indicated. Each bar represents an individual tumor (Vehicle n=7, DAB+TRAM n=6, PARPi n=5, DAB+TRAM+PARPi n=6). Left axis indicates the log2 of fold change in tumor volume, and right axis indicates the percentage change in tumor volume relative to day 0. Dabrafenib (DAB, BRAF inhibitor), trametinib (TRAM, MEK inhibitor), olaparib (PARPi, PARP inhibitor). (I) Overexpression of RAD51 suppresses death in response to MAPK/HDAC inhibition. Western blot confirms overexpression.

