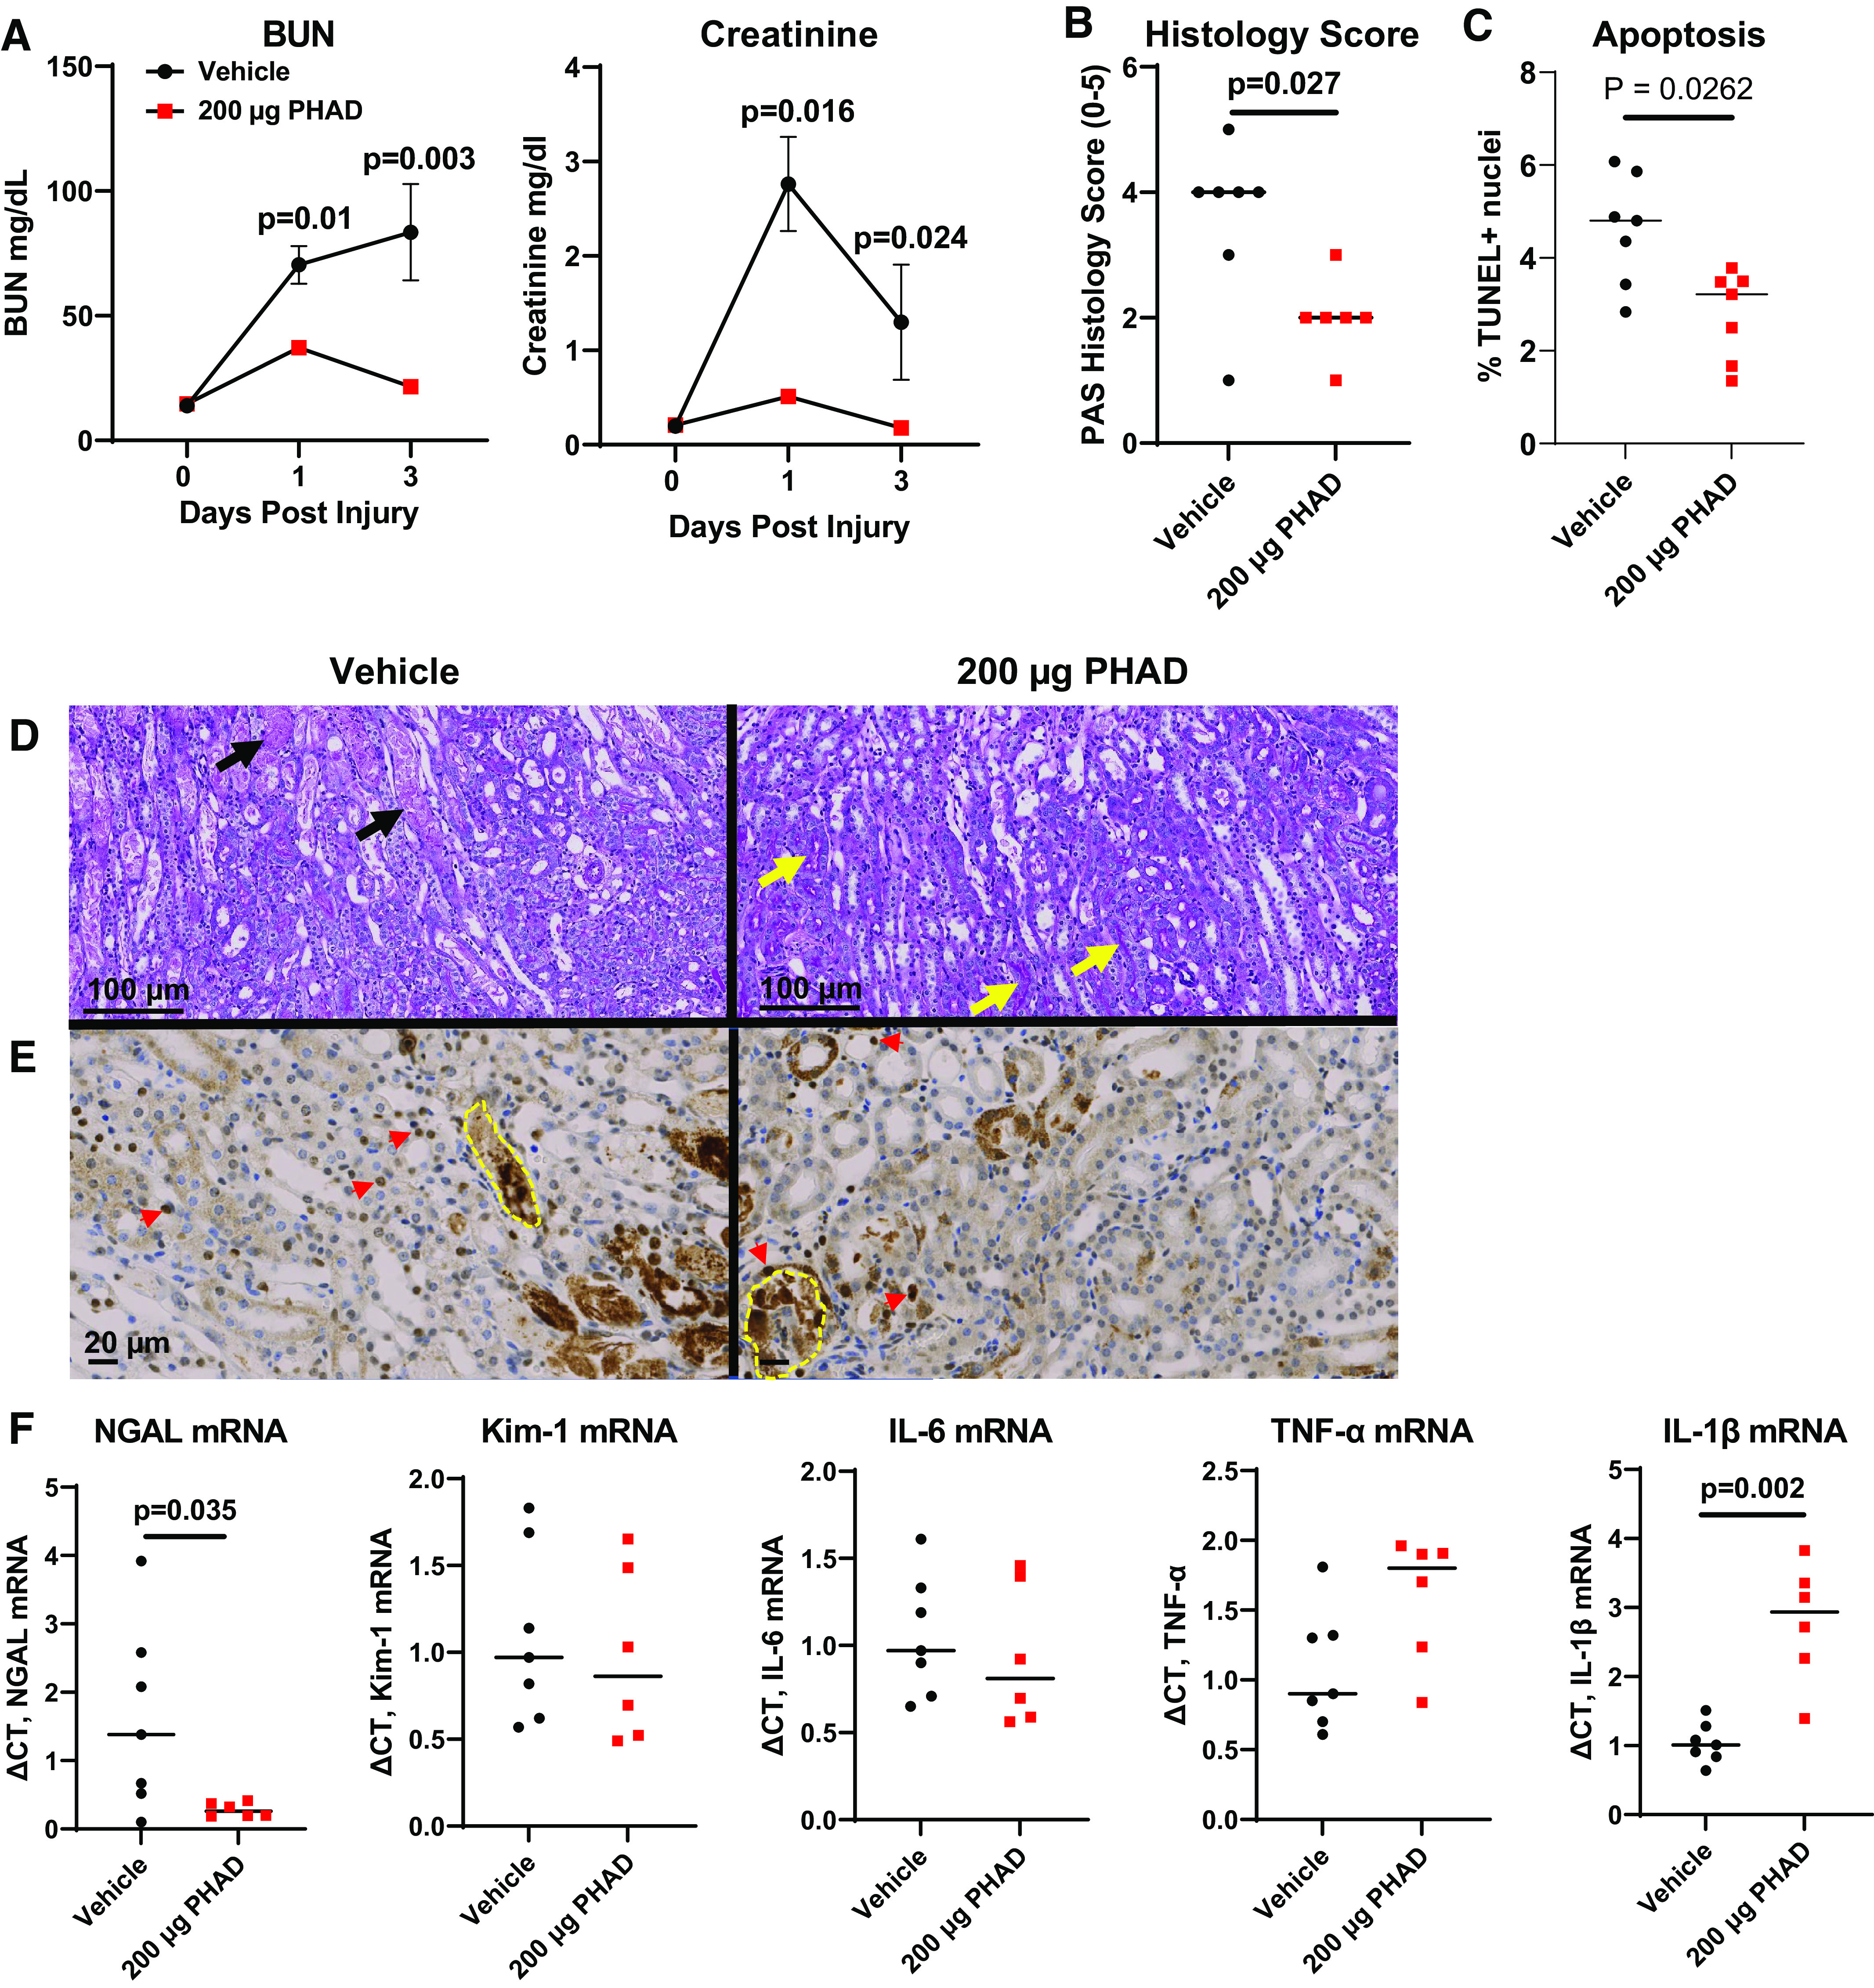
Figure 2.

Pretreatment with 3-deacyl 6-acyl phosphorylated hexaacyl disaccharide (PHAD) in mice that underwent bilateral ischemia-reperfusion injury-induced acute kidney injury. Mice were pretreated with intravenous PHAD at 200 µg/mouse or vehicle control 48 and 24 h prior to undergoing bilateral renal pedicle clamping for 24 min. A: blood was analyzed for blood urea nitrogen (BUN) and creatinine at baseline (day 0) and postinjury days 1 and 3. Results are expressed as means ± SE with n = 10. Two-way ANOVA was used to evaluate between-group differences over time (P < 0.05 for both BUN and serum creatinine), with P values shown after Sidak’s correction for multiple post hoc between-group comparisons at each time point. B: tubular injury scores in the outer stripe of the outer medulla from periodic acid-Schiff (PAS)-stained sections day 3 after injury. C: apoptosis in the outer stripe of the outer medulla from TUNEL-stained sections day 3 after injury. D: representative images of PAS-stained sections of the outer medulla day 3 after injury in sham, vehicle-treated, and PHAD-treated mice. Black arrows point to severely injured tubules showing flattening of the surviving epithelium and the presence of cellular debris within the tubular lumen. Yellow arrows indicate PAS-positive brush borders of uninjured S3 segment proximal tubule epithelial cells. Scale bar = 100 µm. E: representative images of TUNEL-stained sections of the outer medulla day 3 after injury in vehicle- and PHAD-treated mice. Red arrowheads indicate examples of TUNEL-positive tubular nuclei. Yellow dotted lines indicate necrotic TUNEL-positive tubular casts excluded from the analysis. Scale bar = 20 µm. F: quantitative RT-PCR for renal expression of neutrophil gelatinase-associated lipocalin (Ngal), kidney injury molecule-1 (Kim-1), interleukin-6 (IL-6), tumor necrosis factor-α (Tnf-α), and interleukin-1β (IL-1β) mRNAs day 3 after injury. GAPDH was used as the internal control for quantitative RT-PCR, and change in threshold cycle (ΔCt) values is graphed relative to the vehicle group. For B, C, and F, individual data points and medians are shown, and P values with a significant difference are shown from a Mann–Whitney U test used to compare groups. n = 6 or 7.
