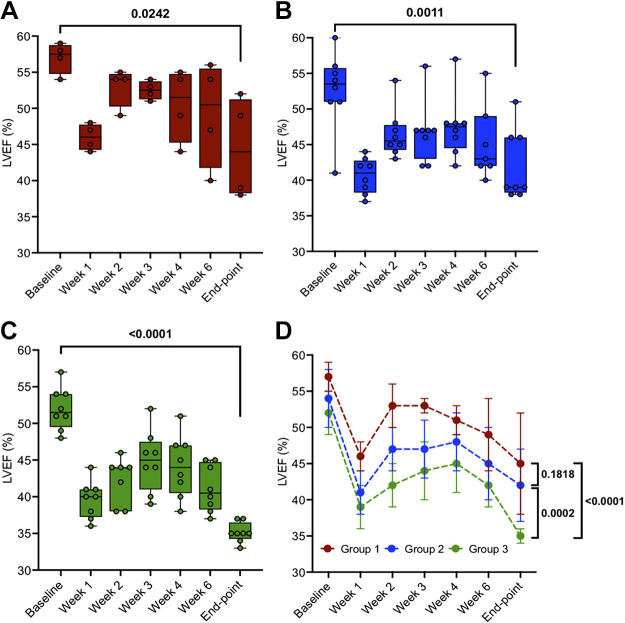
Figure 3.
Left ventricular ejection fraction (LVEF) from “baseline” to “end point” in three groups: group 1, n = 4 (A), group 2, n = 8 (B), and group 3, n = 8 (C). D: means ± SD data of individual groups. Two-tailed paired t tests were used to compare data between two time points (baseline vs. end point) within the same group (A, B, and C). Two-way mixed ANOVA model for D was conducted with a post hoc test using Bonferroni correction to analyze the time effect (P < 0.0001), groups effect (P < 0.0001), and time/groups interaction effect (P = 0.6508) on LVEF. Post hoc tests with Bonferroni correction are shown at end points between the three groups.

