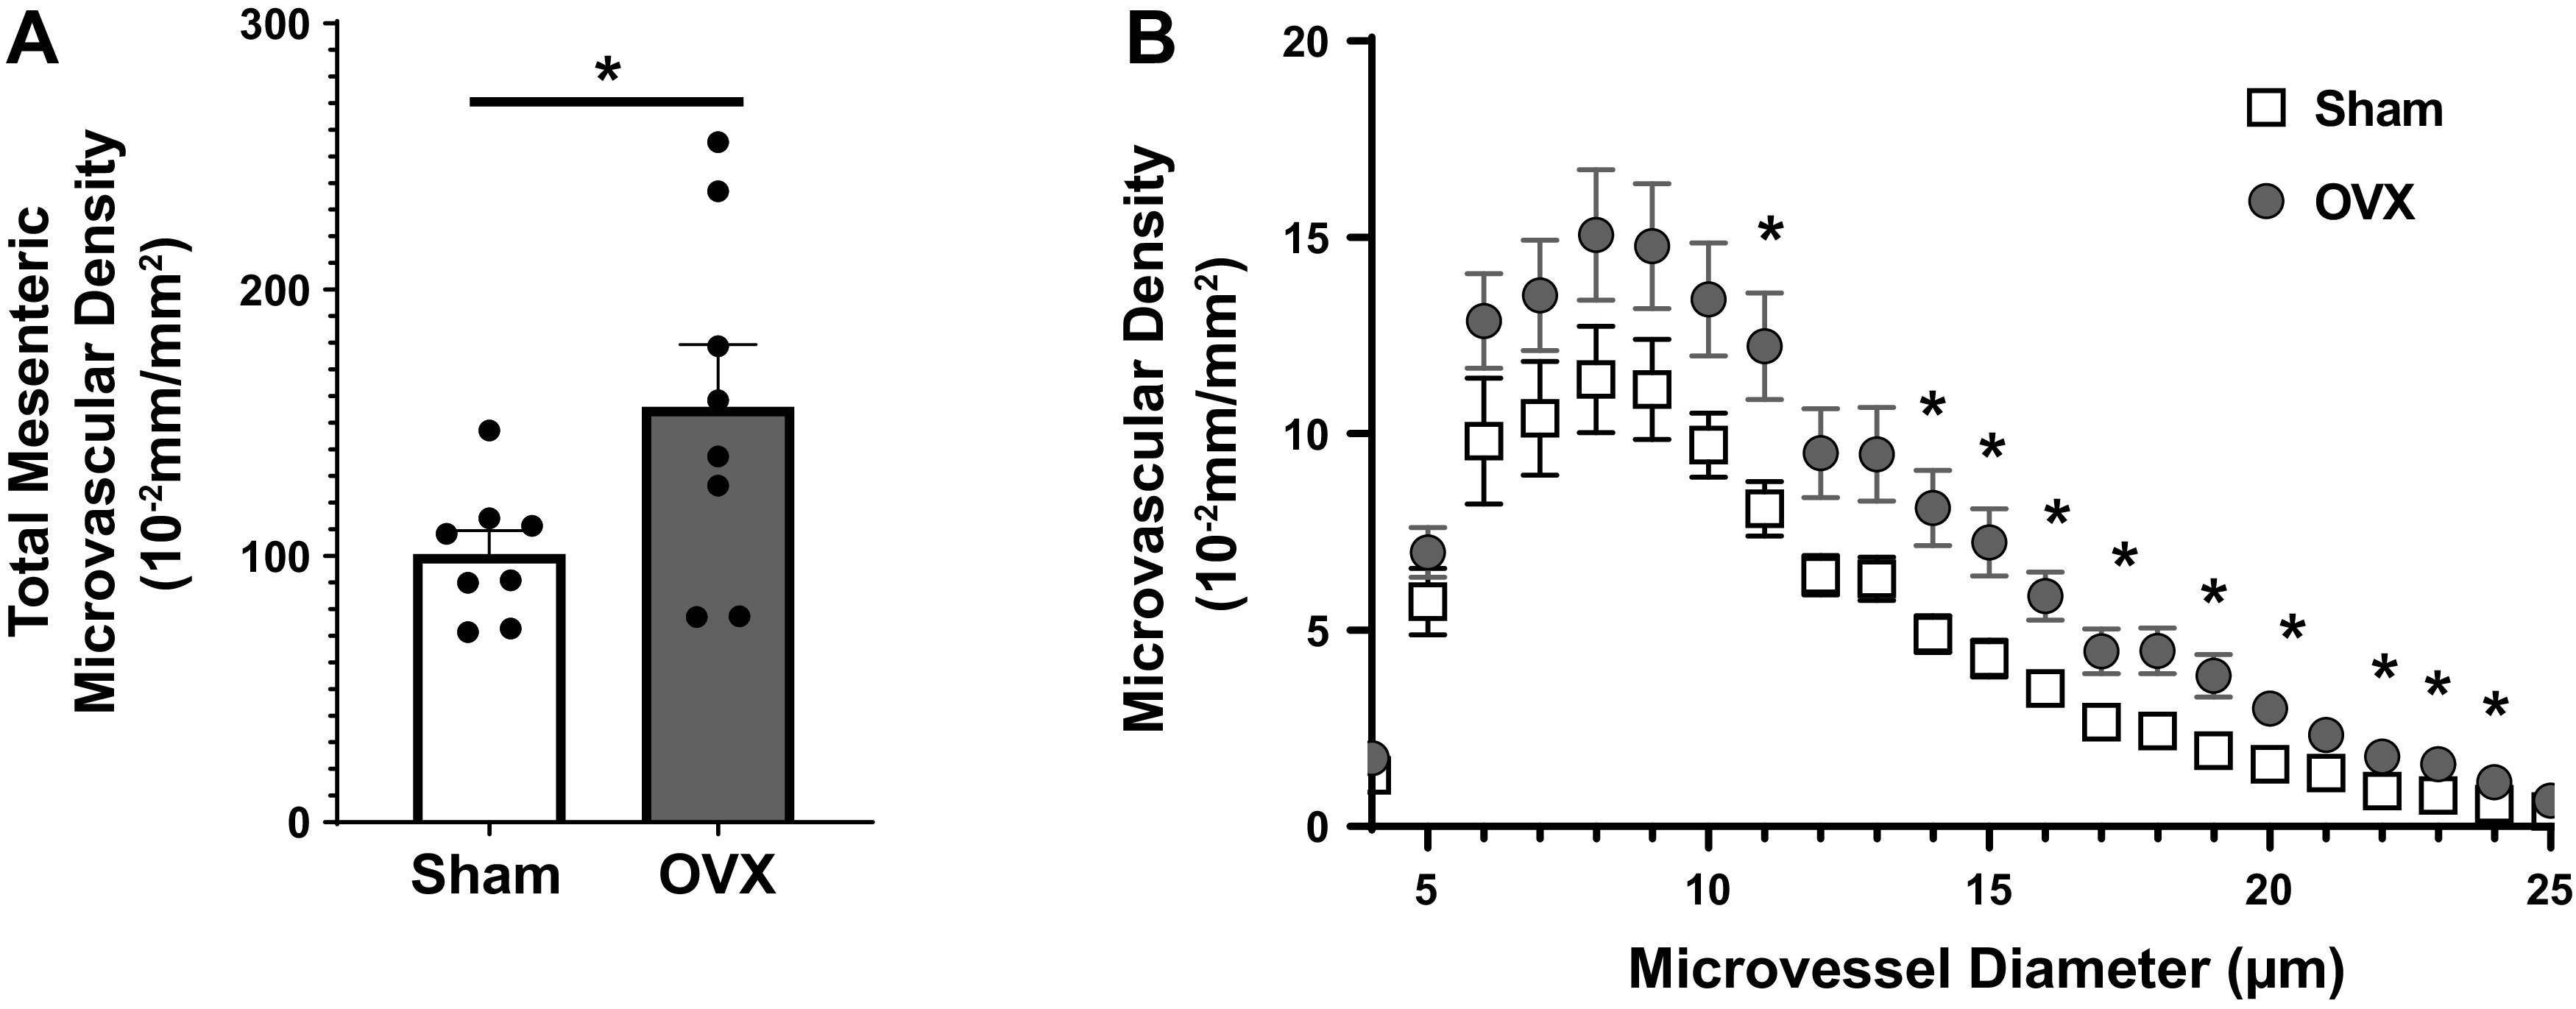
Figure 3.

A: total mesenteric microvascular density in sham (n = 8) and ovariectomized (OVX) (n = 8) mice after EHS. Dots represent individual values and bars represent mean and standard deviation. B: microvascular density as a function of microvessel diameter ranging from 5 to 25 µm. *P < 0.05, ANOVA.
