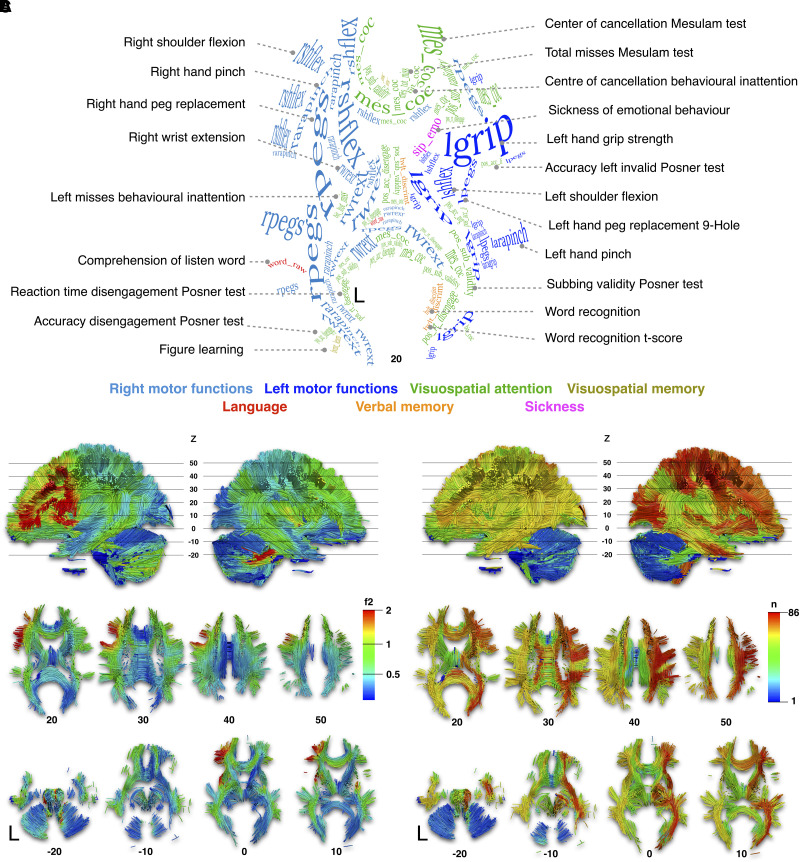
Figure 4.
NWMA. (A) The axial projection of the labelling of neuropsychological scores corresponds to the strongest white matter associations. Visit https://neurovault.org/collections/11260/ or Supplementary material, Section C to view individual neuropsychological white matter maps. The labelling text font size and curvature reported were manually set to suit the size of the significant clusters and to follow the orientation of the white matter (see Supplementary material, Section D for high-resolution images). (B) The colour map corresponds to the highest effect size score (f2) across neuropsychological scores. (C) The colour map corresponds to the number (n) of neuropsychological scores overlapping their effect size map distributions. Such overlap will be addressed as versatility maps. MNI152 reference Z coordinates are reported below each axial slice.

